Clinical data, enrollment
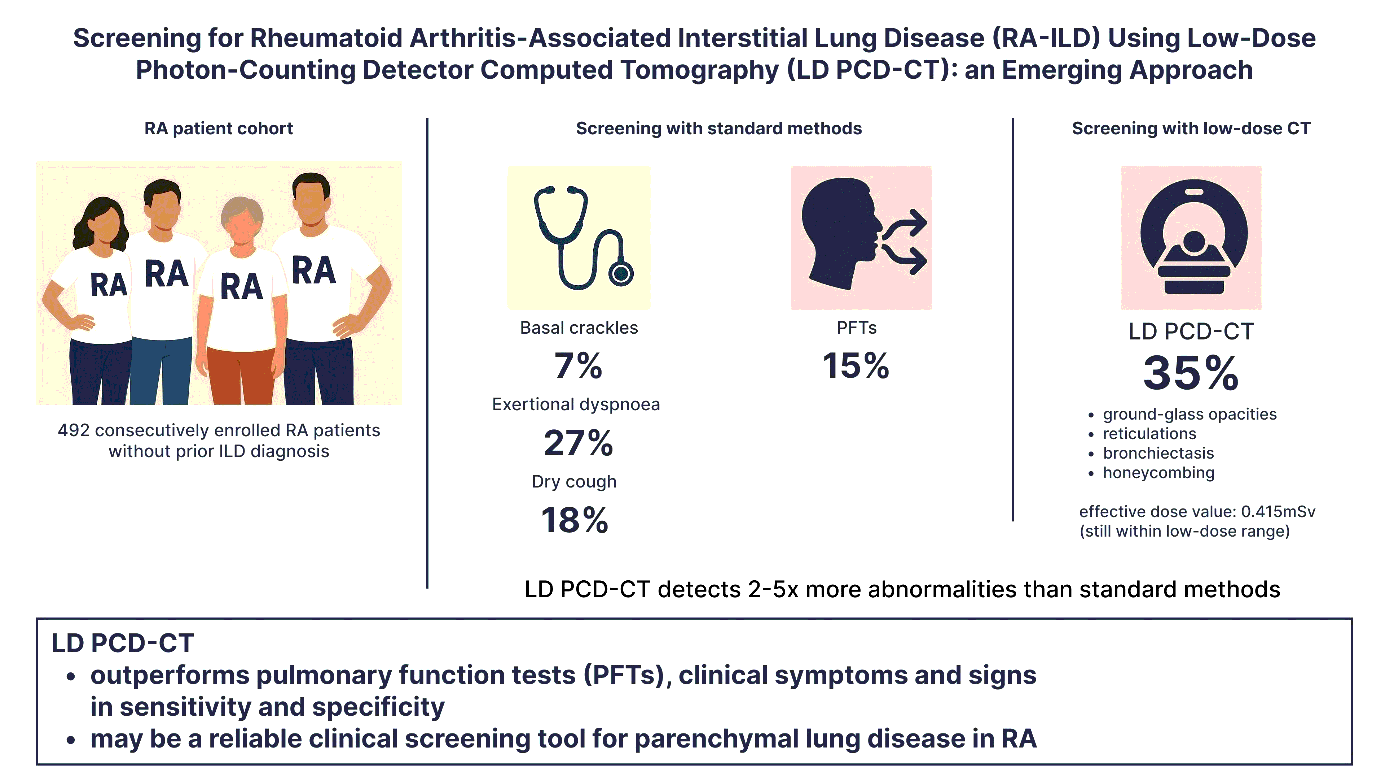
A total of 544 consecutive RA patients were initially recruited for the study. Of these, 39 individuals were excluded during the study period due to either the development of acute lung infections or withdrawal of consent, resulting in 505 patients completing the baseline visit. Subsequently, four patients were excluded due to discrepancies in identification or laboratory data, and nine were excluded due to non-evaluable chest X-rays. Therefore, the final analysis included data from 492 RA patients. 7% (n = 36) of them were found to have basal crackles, 18% (n = 87) had a dry cough and 29% (n = 139) had exertional dyspnoea. Detailed clinical and demographic characteristics are presented in tables 1 and 2.
|
Table 1. Baseline demographic, serologic and medication characteristics of RA patients
|
|
| |
Overall RA patients (n = 492)
|
LD PCD-CT
total ILD score ≥ 3 (n = 171)
|
LD PCD-CT
total ILD score < 3 (n = 321)
|
p-value
|
|
Demographics
|
|
Age (years)
|
62.79 ± 10.44
|
66.51 ± 9.47
|
60.81 ± 10.41
|
< 0.001
|
|
Age over 65 years, n (%)
|
236 (48%)
|
107 (63%)
|
129 (40%)
|
< 0.001
|
|
Age over 50 years at RA onset, n (%)
|
249 (52%)
|
104 (63%)
|
145 (46%)
|
< 0.001
|
|
Male sex, n (%)
|
88 (18%)
|
41 (24%)
|
47 (15%)
|
0.010
|
|
Smoking history
|
|
Ever smoking, n (%)
|
249 (51%)
|
95 (57%)
|
154 (48%)
|
0.089
|
|
Current smoking, n (%)
|
71 (15%)
|
30 (18%)
|
41 (13%)
|
0.141
|
|
Smoking (pack-years)
|
10.07 ± 16.26
|
13.28 ± 18.96
|
8.42 ± 14.41
|
0.015
|
|
Pack-year ≥ 25, n (%)
|
76 (16%)
|
39 (23%)
|
37 (12%)
|
0.001
|
|
RA characteristics
|
|
RA duration (years)
|
14.27 ± 10.23
|
15.53 ± 11.53
|
13.61 ± 9.43
|
0.250
|
|
DAS28-ESR
|
2.79 ± 1.29
|
2.85 ± 1.26
|
2.75 ± 1.30
|
0.381
|
|
BMI (kg/m2)
|
26.66 ± 5.00
|
26.98 ± 5.04
|
26.49 ± 4.98
|
0.229
|
|
RA serologies
|
|
RF (U/mL)
|
108.93 ± 195.21
|
146.37 ± 242.83
|
87.92 ± 159.19
|
0.013
|
|
RF positivity, n (%) (> 14U/mL)
|
335 (69%)
|
130 (77%)
|
205 (65%)
|
0.005
|
|
Anti-CCP (U/mL)
|
644.23 ± 1022.77
|
704.08 ± 1073.90
|
611.11 ± 993.66
|
0.086
|
|
Anti-CCP positivity, n (%) (> 25 U/mL)
|
311 (65%)
|
119 (71%)
|
192 (62%)
|
0.042
|
|
Anti-MCV positivity, n (%) (> 20 U/mL)
|
274 (61%)
|
104 (65%)
|
170 (58%)
|
0.171
|
|
RF + anti-CCP positivity, n (%)
|
282 (58%)
|
112 (67%)
|
170 (54%)
|
0.008
|
|
RA medication
|
|
JAK inhibitors, n (%)
|
44 (9%)
|
15 (9%)
|
29 (9%)
|
0.944
|
|
Rituximab, n (%)
|
29 (6%)
|
9 (5%)
|
20 (6%)
|
0.680
|
|
Abatacept, n (%)
|
12 (2%)
|
6 (4%)
|
6 (2%)
|
0.356
|
|
Anti-IL6 antibodies, n (%)
|
69 (14%)
|
28 (17%)
|
41 (13%)
|
0.257
|
|
TNF inhibitors, n (%)
|
209 (43%)
|
70 (42%)
|
139 (44%)
|
0.665
|
|
Leflunomid, n (%)
|
137 (28%)
|
44 (26%)
|
93 (29%)
|
0.477
|
|
MTX, n (%)
|
466 (95%)
|
160 (95%)
|
306 (96%)
|
0.602
|
|
Steroid, n (%)
|
421 (86%)
|
142 (85%)
|
279 (88%)
|
0.322
|
Results are presented as mean ± standard deviation, median (interquartile range) and frequency (percentage). Significant differences (p<0.05) are highlighted in bold.
RA: rheumatoid arthritis; RF: rheumatoid factor; anti-CCP: anti cyclic citrullinated peptide antibody; anti-MCV: anti citrullinated vimentin antibody; JAK: Janus kinases; IL-6: interleukin 6; TNF: tumor necrosis factor, MTX: methotrexate
|
Table 2. Baseline clinical, radiological and laboratory parameters of RA patients
|
|
| |
Overall RA patients (n = 492)
|
LD PCD-CT
total ILD score ≥ 3 (n = 171)
|
LD PCD-CT
total ILD score < 3 (n = 321)
|
p-value
|
|
Respiratory signs, symptoms
|
|
Basal crackles, n (%)
|
36 (7%)
|
21 (12%)
|
15 (5%)
|
0.002
|
|
Exertional dyspnoea, n (%)
|
139 (29%)
|
45 (27%)
|
94 (30%)
|
0.520
|
|
Dry cough, n (%)
|
87 (18%)
|
30 (18%)
|
57 (18%)
|
0.985
|
|
Pulmonary function tests and pulmonary parameters
|
|
FEV1 (L)
|
2.49 ± 0.63
|
2.36 ± 0.50
|
2.56 ± 0.68
|
0.015
|
|
FEV1% predicted
|
95.32 ± 16.57
|
96.17 ± 16.71
|
94.84 ± 16.51
|
0.998
|
|
FEV 1 < 80% predicted
|
48 (14%)
|
14 (12%)
|
34 (16%)
|
0.286
|
|
FVC (L)
|
3.14 ± 0.77
|
3.00 ± 0.66
|
3.22 ± 0.81
|
0.026
|
|
FVC % predicted
|
94.99 ± 15.48
|
95.61 ± 16.63
|
94.65 ± 14.85
|
0.800
|
|
FVC < 80% predicted
|
56 (17%)
|
18 (15%)
|
38 (18%)
|
0.563
|
|
TLC (L)
|
5.92 ± 2.08
|
5.76 ± 1.01
|
6.02 ± 2.49
|
0.510
|
|
TLC % predicted
|
114.93 ± 20.09
|
115.44 ± 19.19
|
114.65 ± 20.60
|
0.607
|
|
DLCO (mmol/min/kPa)
|
8.83 ± 2.01
|
8.29 ± 1.90
|
9.14 ± 2.01
|
< 0.001
|
|
DLCO % predicted
|
122.16 ± 20.89
|
117.65 ± 20.09
|
124.65 ± 20.95
|
0.003
|
|
DLCO < 75% predicted
|
7 (2%)
|
4 (3%)
|
3 (1%)
|
0.251
|
|
Radiogical findings
|
|
X-Ray
|
|
Fibrosis, n (%)
|
14 (4%)
|
11 (6%)
|
3 (1%)
|
0.001
|
|
LD PCD-CT
|
|
dUIP, n (%)
|
11 (2%)
|
10 (6%)
|
1
|
< 0.001
|
|
pUIP, n (%)
|
7 (1%)
|
7 (4%)
|
0
|
0.001
|
|
iUIP, n (%)
|
6 (1%)
|
6 (4%)
|
0
|
0.002
|
|
NSIP, n (%)
|
8 (2%)
|
8 (5%)
|
0
|
< 0.001
|
|
RB-ILD, n (%)
|
4 (1%)
|
4 (2%)
|
0
|
0.014
|
|
PPFE, n (%)
|
10 (2%)
|
4 (2%)
|
6 (2%)
|
0.744
|
|
NSSEPC, n (%)
|
64 (13%)
|
37 (22%)
|
27 (9%)
|
< 0.001
|
|
Laboratory parameters
|
|
ESR (mm/h)
|
18.25 ± 16.22
|
19.78 ± 16.45
|
17.40 ± 16.06
|
0.056
|
|
ESR > 20 mm/h, n (%)
|
138 (31%)
|
55 (35%)
|
83 (29%)
|
0.191
|
|
CRP (mg/mL)
|
6.97 ± 11.86
|
7.35 ± 11.89
|
6.75 ± 11.86
|
0.042
|
|
CA 15 − 3 (U/mL)
|
21.33 ± 10.08
|
23.89 ± 12.54
|
20.01 ± 8.26
|
0.008
|
|
CA 15 − 3 > 25 U/mL, n (%)
|
128 (30%)
|
52 (35%)
|
76 (27%)
|
0.060
|
|
LDH (U/L)
|
208.28 ± 44.10
|
217.32 ± 47.17
|
203.19 ± 41.50
|
0.003
|
|
LDH > 214 U/L, n (%)
|
170 (39%)
|
75 (47%)
|
95 (34%)
|
0.005
|
Results are presented as mean ± standard deviation and frequency (percentage). Significant differences (p<0.05) are highlighted in bold.
FEV1: forced expiratory volume in 1 second; FVC: forced vital capacity; TLC: total lung capacity; DLCO: diffusion capacity of the lung for carbon monoxide; dUIP: definite usual interstitial pneumonia; pUIP: probable usual interstitial pneumonia; iUIP: indeterminate usual interstitial pneumonia; NSIP: non-specific interstitial pneumonia; PPFE: pleuro-parenchymal fibroelastosis; RB-ILD: respiratory bronchiolitis interstitial lung disease; NSSEPC: non-specified small extension parenchymal changes; ESR: erythrocyte sedimentation rate; CRP: C-reactive protein; CA 15-3: cancer antigen 15-3; LDH: lactate dehydrogenase
Imaging findings
All patients underwent digital radiography and consecutive LD PCD-CT scans at baseline. The median (IQR) total ILD CT score was 2 (0; 3); a threshold score ≥ 3 was considered clinically significant. Fibrotic changes were identified in only 4% of patients on chest radiography (n = 14). In contrast, LD PCD-CT revealed interstitial alterations in 35% (n = 171), of whom only 6.5% showed fibrotic signs on X-ray.
Regarding the CT patterns UIP has been found in 22%, PPFE in 9%, NSIP in 7% and RB-ILD in 4% of the patients. Small extension interstitial lung abnormalities were identified in 58% of the cases (Fig. 1).
Radiation Exposure
The effective radiation dose of DR was 0.171 ± 0.286 mSv, with a median dose of 0.067 (0.043–0.127) mSv. LD PCD-CT showed a significantly higher but still low radiation dose of 0.415 ± 0.316 mSv, with a median of 0.378 (0.322–0.455) mSv (p < 0.001).
Pulmonary Function Parameters
Pulmonary function tests were available for 363 patients. Mean spirometric parameters fell within the physiological ranges. The mean predicted FVC was 95.00 ± 15.48%, while the diffusing capacity for DLCO was 122.16 ± 20.89%. Among patients with ILD CT score ≥ 3, only 12% had FVC < 80%, and 3% had DLCO < 75%. A mild but significant negative correlation was observed between ILD CT score and DLCO (r = − 0.224, p < 0.001). The sensitivity and specificity of pulmonary function tests for ILD detection were 21% and 77%, respectively (Table 2, Fig. 2).
Risk Profiles
Clinical and laboratory characteristics of the RA patients were analyzed to identify potential associations with interstitial lung involvement. The median age at diagnosis in our cohort was 50 (40–60) years; accordingly, age ≥ 50 years at diagnosis was used as a clinical threshold for risk stratification. Receiver operating characteristic (ROC) curve analysis of smoking history identified an optimal cut-off value of 25 pack-years, which was subsequently adopted as the threshold to define high-risk smoking exposure.
Univariate analysis using binary logistic regression (Enter method) revealed that older age, age ≥ 50 years at RA diagnosis, male sex at birth, smoking exposure ≥ 25 pack-years, RF and aCCP positivity, and elevated LDH levels were significantly associated with a total ILD CT score ≥ 3.
Multivariate logistic regression using the backward (likelihood ratio) method identified five independent predictors of interstitial lung involvement: older age (OR 2.594 [95% CI 1.686, 3.989] p < 0.001), smoking exposure ≥ 25 pack-years (OR 1.885 [95% CI 1.070, 3.322] p < 0.028), male sex (OR 1.741 [95% CI 1.003, 3.023] P = 0.049), RF positivity (OR 1.952 [95% CI 1.214, 3.319] p = 0.006), and high LDH levels (OR 1.872 [95% CI 1.214, 2.885] p = 0.005) (Table 3).
Table 3
Association between LD PCD-CT findings, clinical and serological features
| |
Univariate analysis
|
Multivariate analysis
|
| |
ODDS
|
95% CI
|
p
|
ODDS
|
95% CI
|
p
|
|
Categorical variables
|
|
Age over 65 years
|
2.488
|
1.699–3.645
|
< 0.001
|
2.594
|
1.686–3.989
|
< 0.001
|
|
Age over 50 years at RA onset
|
2.011
|
1.367–2.957
|
< 0.001
|
|
|
|
|
Male sex
|
1.839
|
1.151–2.936
|
0.011
|
1.741
|
1.003–3.023
|
0.049
|
|
Ever smoking
|
1.386
|
0.951–2.019
|
0.089
|
|
|
|
|
Pack-years ≥ 25
|
2.288
|
1.393–3.756
|
0.001
|
1.885
|
1.070–3.322
|
0.028
|
|
RF positivity (> 14 U/mL)
|
1.852
|
1.206–2.845
|
0.005
|
1.952
|
1.214–3.319
|
0.006
|
|
Anti-CCP positivity (> 25 U/mL)
|
1.518
|
1.014–2.272
|
0.043
|
|
|
|
|
RF + anti-CCP positivity
|
1.694
|
1.147–2.502
|
0.008
|
|
|
|
|
Anti-MCV positivity (> 20 U/mL)
|
1.322
|
0.886–1.972
|
0.171
|
|
|
|
|
JAK inhibitors
|
0.977
|
0.508–1.878
|
0.944
|
|
|
|
|
Rituximab
|
0.843
|
0.775–1.896
|
0.680
|
|
|
|
|
Abatacept
|
1.926
|
0.611–6.067
|
0.263
|
|
|
|
|
Anti-IL6 antibodies
|
1.351
|
0.802–2.277
|
0.258
|
|
|
|
|
TNF inhibitors
|
0.920
|
0.630–1.343
|
0.665
|
|
|
|
|
Leflunomid
|
0.858
|
0.564–1.307
|
0.477
|
|
|
|
|
MTX
|
0.784
|
0.314–1.958
|
0.603
|
|
|
|
|
Steroid
|
0.763
|
0.447–1.305
|
0.323
|
|
|
|
|
Elevated LDH level (> 214 U/L)
|
0.758
|
1.181–2.615
|
0.005
|
1.872
|
1.214–2.885
|
0.005
|
|
Elevated CRP level (> 5 mg/mL)
|
1.345
|
0.895–2.022
|
0.154
|
|
|
|
|
Elevated CA15-3 level (> 25 U/mL)
|
1.505
|
0.981–2.309
|
0,061
|
|
|
|
|
ESR > 20 mm/h
|
1.319
|
0.871–1.997
|
0.191
|
|
|
|
|
Basal crackles
|
2.886
|
1.446–5.761
|
0.003
|
|
|
|
|
Exertional dyspnoea
|
0.872
|
0.574–1.324
|
0.520
|
|
|
|
|
Dry cough
|
0.995
|
0.611–1.621
|
0.985
|
|
|
|
|
Continuous variables
|
|
Age
|
1.058
|
1.037–1.079
|
< 0.001
|
|
|
|
|
Pack-years
|
1.018
|
1.006–1.029
|
0.003
|
|
|
|
|
DAS28-ESR
|
1.063
|
0.920–1.230
|
0.406
|
|
|
|
|
BMI
|
1.020
|
0.982–1.058
|
0.304
|
|
|
|
|
RA duration
|
1.018
|
1.000-1.037
|
0.050
|
|
|
|
|
RF
|
1.001
|
1.000-1.003
|
0.004
|
|
|
|
|
Anti-CCP
|
1.000
|
1.000–1.000
|
0.355
|
|
|
|
|
CRP
|
1.004
|
0.988–1.020
|
0.611
|
|
|
|
|
ESR
|
1.009
|
0.997–1.021
|
0.139
|
|
|
|
|
CA 15 − 3
|
1.039
|
1.018–1.061
|
< 0.001
|
|
|
|
|
LDH
|
1.007
|
1.003–1.012
|
0.002
|
|
|
|
Results from univariate analysis, binary logistic regression using the enter method, and multivariate logistic regression with the backward (likelihood ratio) method. Significant predictors (p<0.05) are highlighted in bold.
The median age at diagnosis in our cohort was 50 years; thus, age ≥50 at diagnosis was considered a clinical risk threshold. Receiver operating characteristic (ROC) curve analysis for smoking history revealed an optimal cut-off at 25 pack-years, which was subsequently used as a threshold to define high-risk smoking exposure in further analysis.
At univariate analysis, older age (>65 years), age ≥50 years at RA diagnosis, male sex at birth, smoking exposure ≥25 pack-years, rheumatoid factor (RF) and anti-cyclic citrullinated peptide (aCCP) positivity, elevated lactate dehydrogenase (LDH) levels were significantly associated with a total ILD CT score ≥3.
Multivariate analysis identified five independent predictors of lung involvement: older age (>65 years), male sex, smoking exposure ≥25 pack-years, RF positivity, and elevated LDH levels.
RF: rheumatoid factor; anti-CCP: anti cyclic citrullinated peptide antibody; anti-MCV: anti citrullinated vimentin antibody; JAK: Janus kinases; IL-6: interleukin 6; TNF: tumor necrosis factor, MTX: methotrexate; LDH: lactate dehydrogenase; CRP: C-reactive protein; CA 15-3: cancer antigen 15-3; ESR: erythrocyte sedimentation rate
Considering a horizontal multi-level hierarchy of diagnostic modalities for detecting subclinical ILD, LD PCD-CT identified interstitial lung involvement-defined as a total CT ILD score ≥ 3-in 171 of 492 RA patients (35%). In contrast, clinical assessment and PFTs detected abnormalities in only 44% and 22% of these LD PVD-CT-positive cases, respectively. DR revealed fibrotic changes in just 6.5% of this subgroup. Notably, among patients without LD PCD-CT-defined ILD, 42% had positive clinical assessments and 23% demonstrated abnormal PFTs, underscoring the limited diagnostic specificity of these conventional approaches in the absence of imaging-confirmed disease. (Fig. 3)