Gut microbiota and bacterial antibiotic resistance of FMT donor chicken
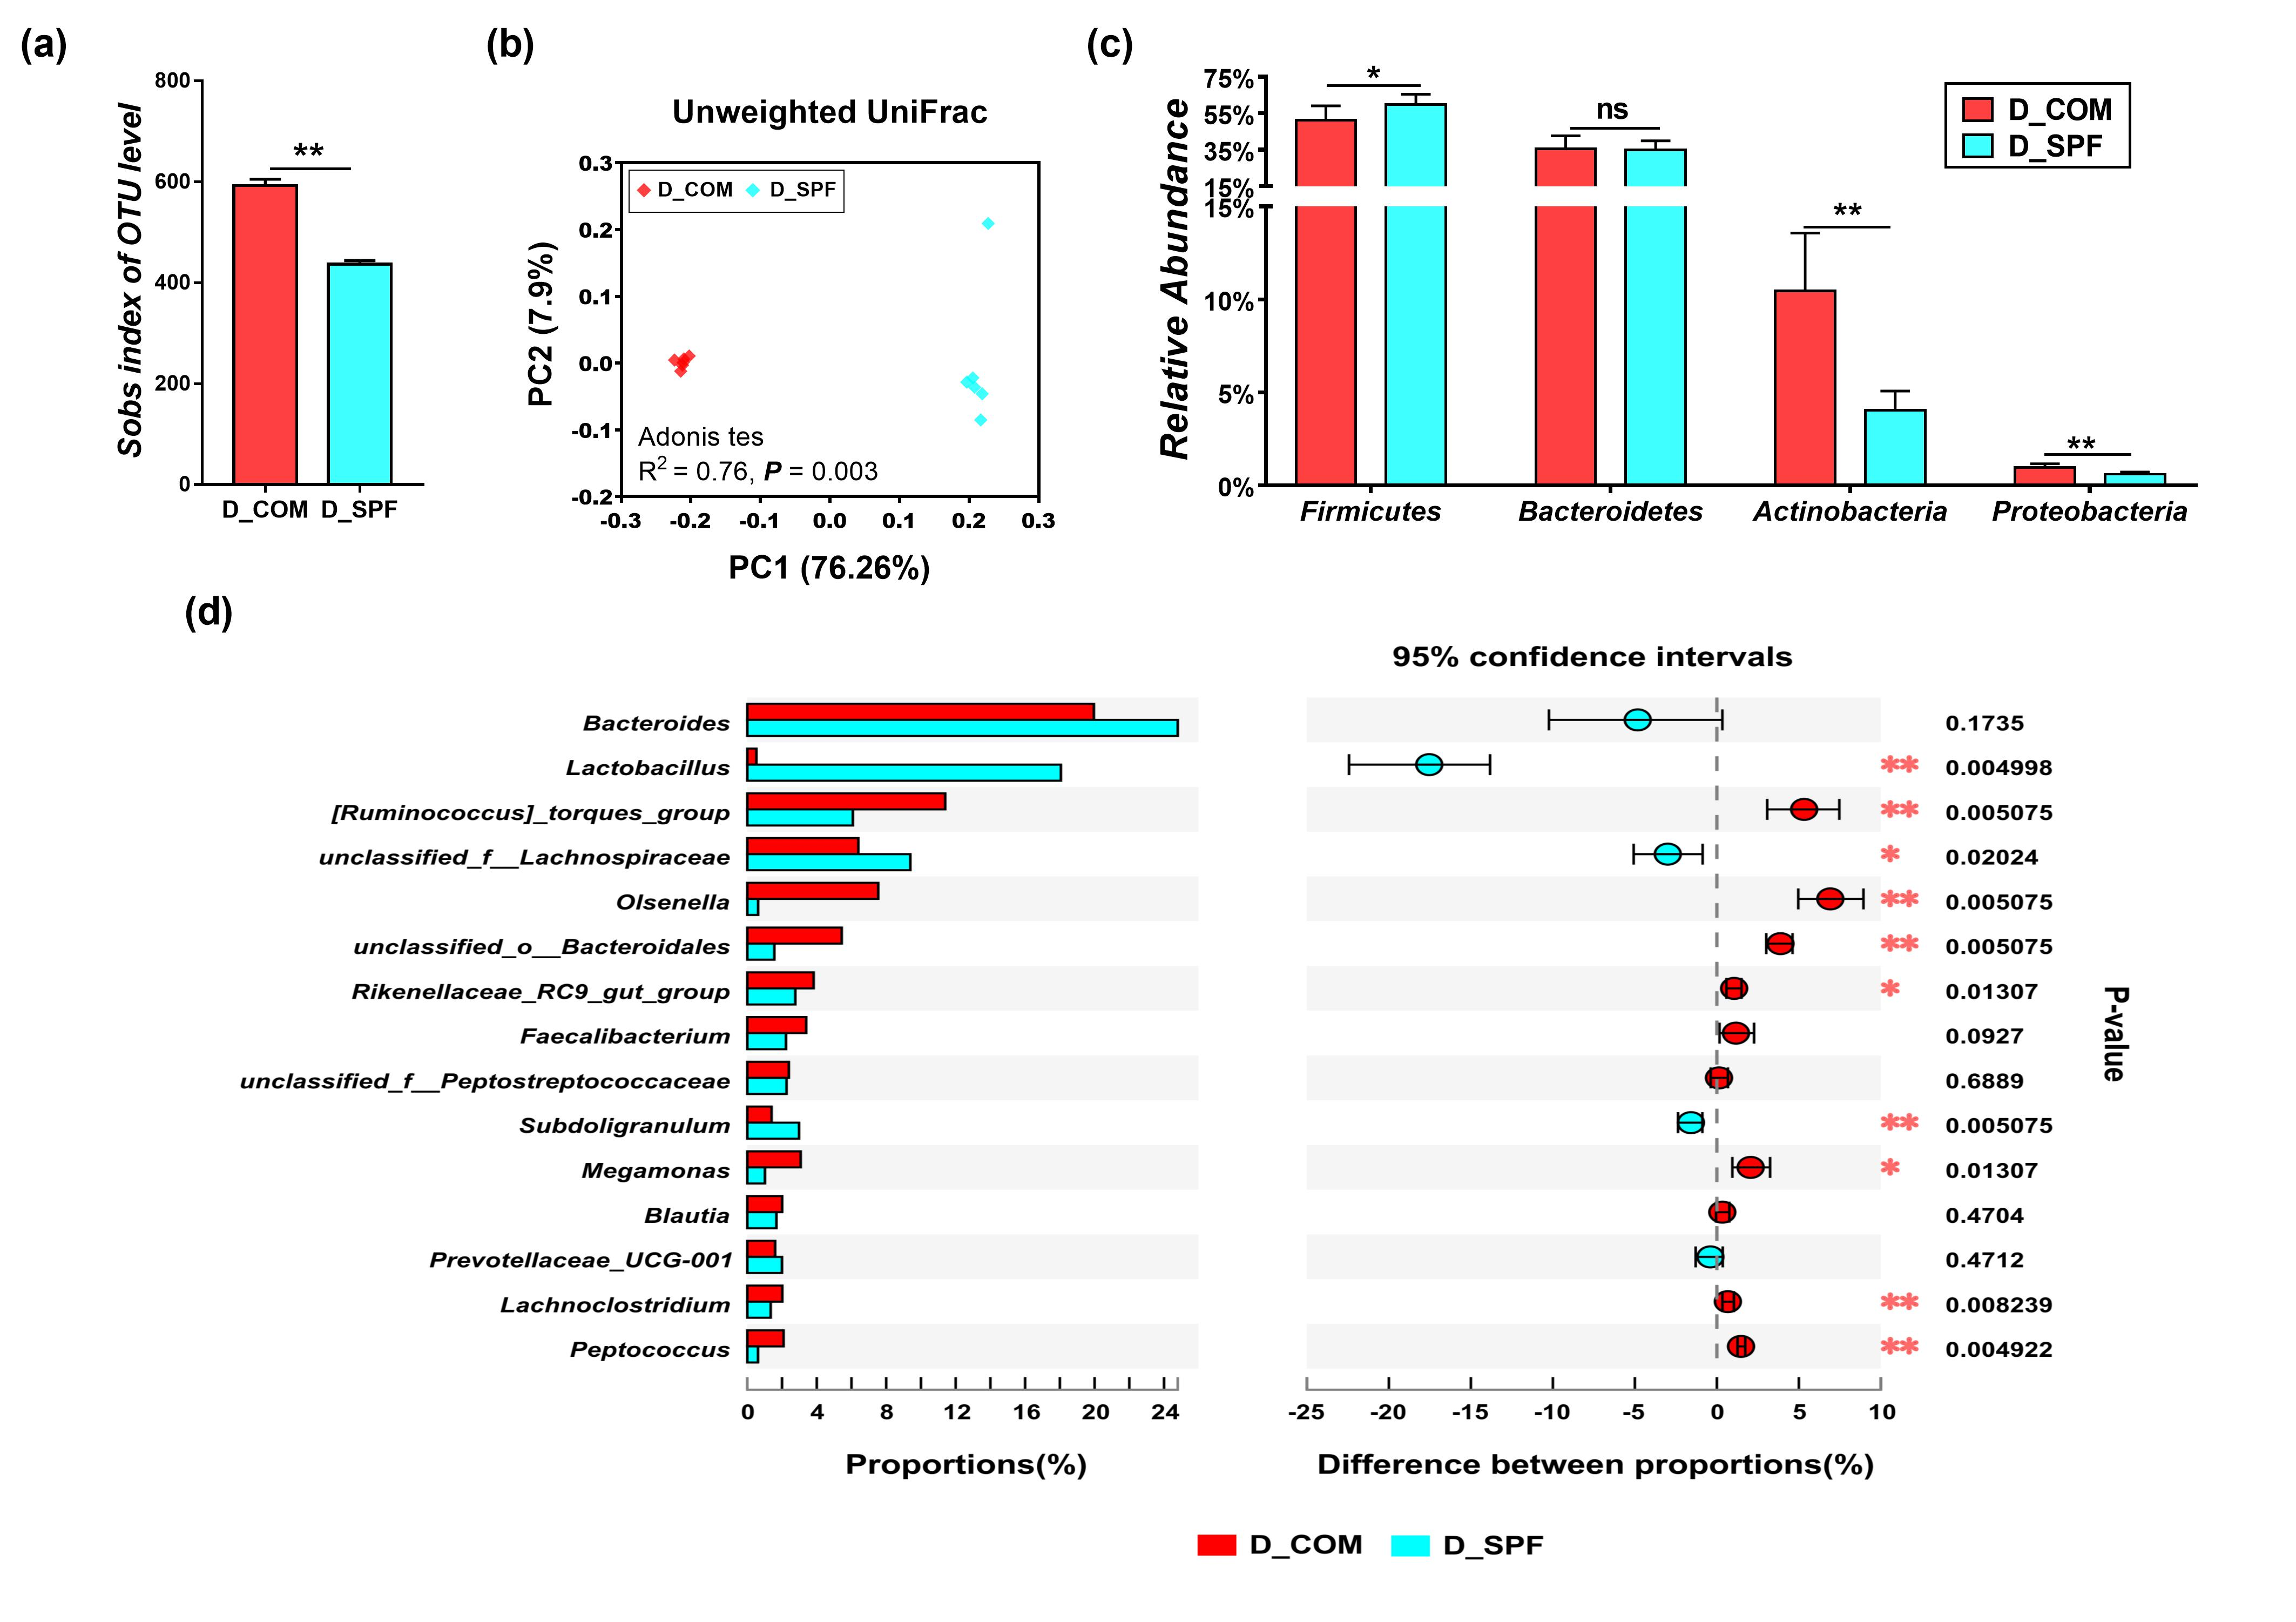
Commercial chicken and SPF chicken were selected as FMT donor due to their different rearing environment and antibiotic usage. The gut micrbiota profile of donor chicken was analyzed with 16S rRNA gene high throughput sequencing technology. Within-sample diversity (α-diversity) revealed that the gut microbiota of commercial chicken (D_COM) had higher diversity than those of SPF chicken (D_SPF) (Fig. S1a). Principal coordinate analysis (PCoA) of Unweighted UniFrac distance showed that the gut microbiota of commercial chicken and SPF chicken formed two distinct clusters and separated from each other (Adonis test, R2 = 0.76, P = 0.003; Fig. S1b), indicating the differences in the gut microbiota profile between SPF chicken and commercial chicken were significant. At the phylum level classification, both of the two groups consisted mainly Firmicutes, Bacteroidetes, Actinobacteria and Proteobacteria. However, Actinobacteria and Proteobacteria were present at higher relative abundance in commercial chicken compared with SPF chicken, whereas the relative abundance of Firmicutes was higher in SPF chicken (P < 0.05, Mann Whitney test; Fig. S1c). At genus level classification, Bacteroides was the dominant genus in both two chicken groups. [Ruminococcus]_torques_group, Olsenella and unclassified_o__Bacteroidales were present at higher relative abundance in commercial chicken compared with SPF chicken, whereas the relative abundance of Lactobacillus and unclassified_f__Lachnospiraceae were higher in SPF chicken. The other genera present, and their relative levels are indicated in Fig. S1d
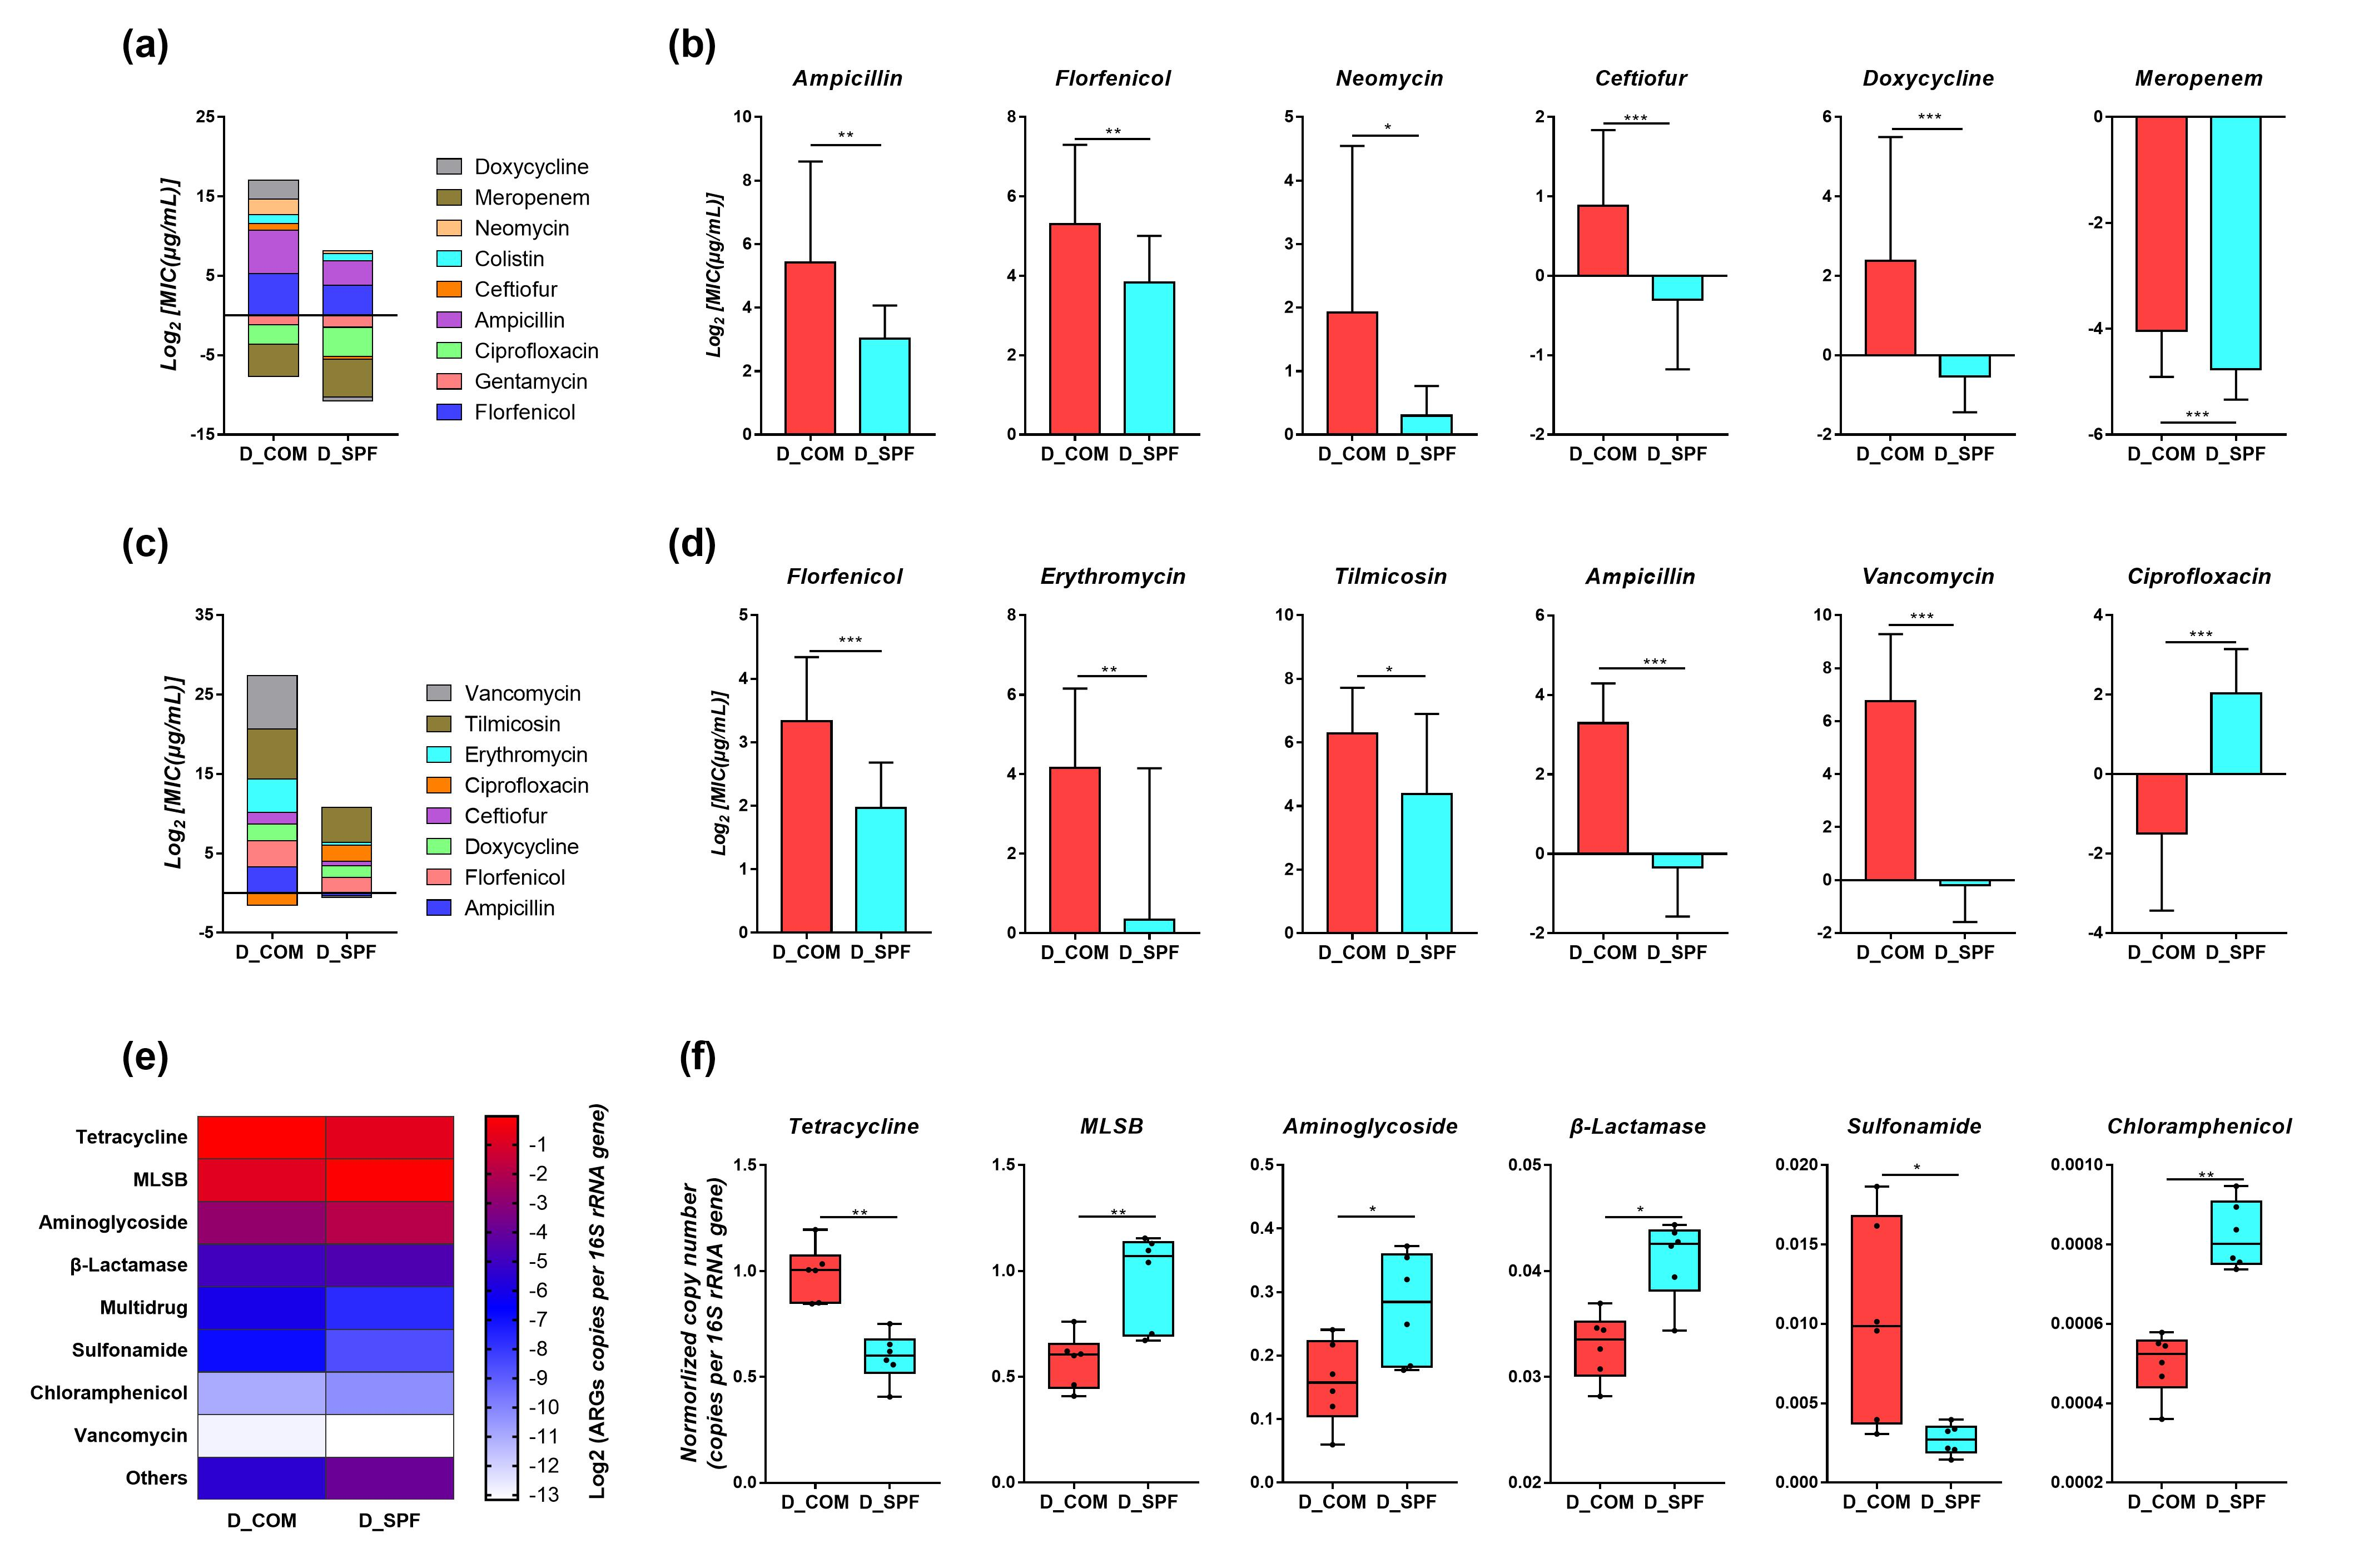
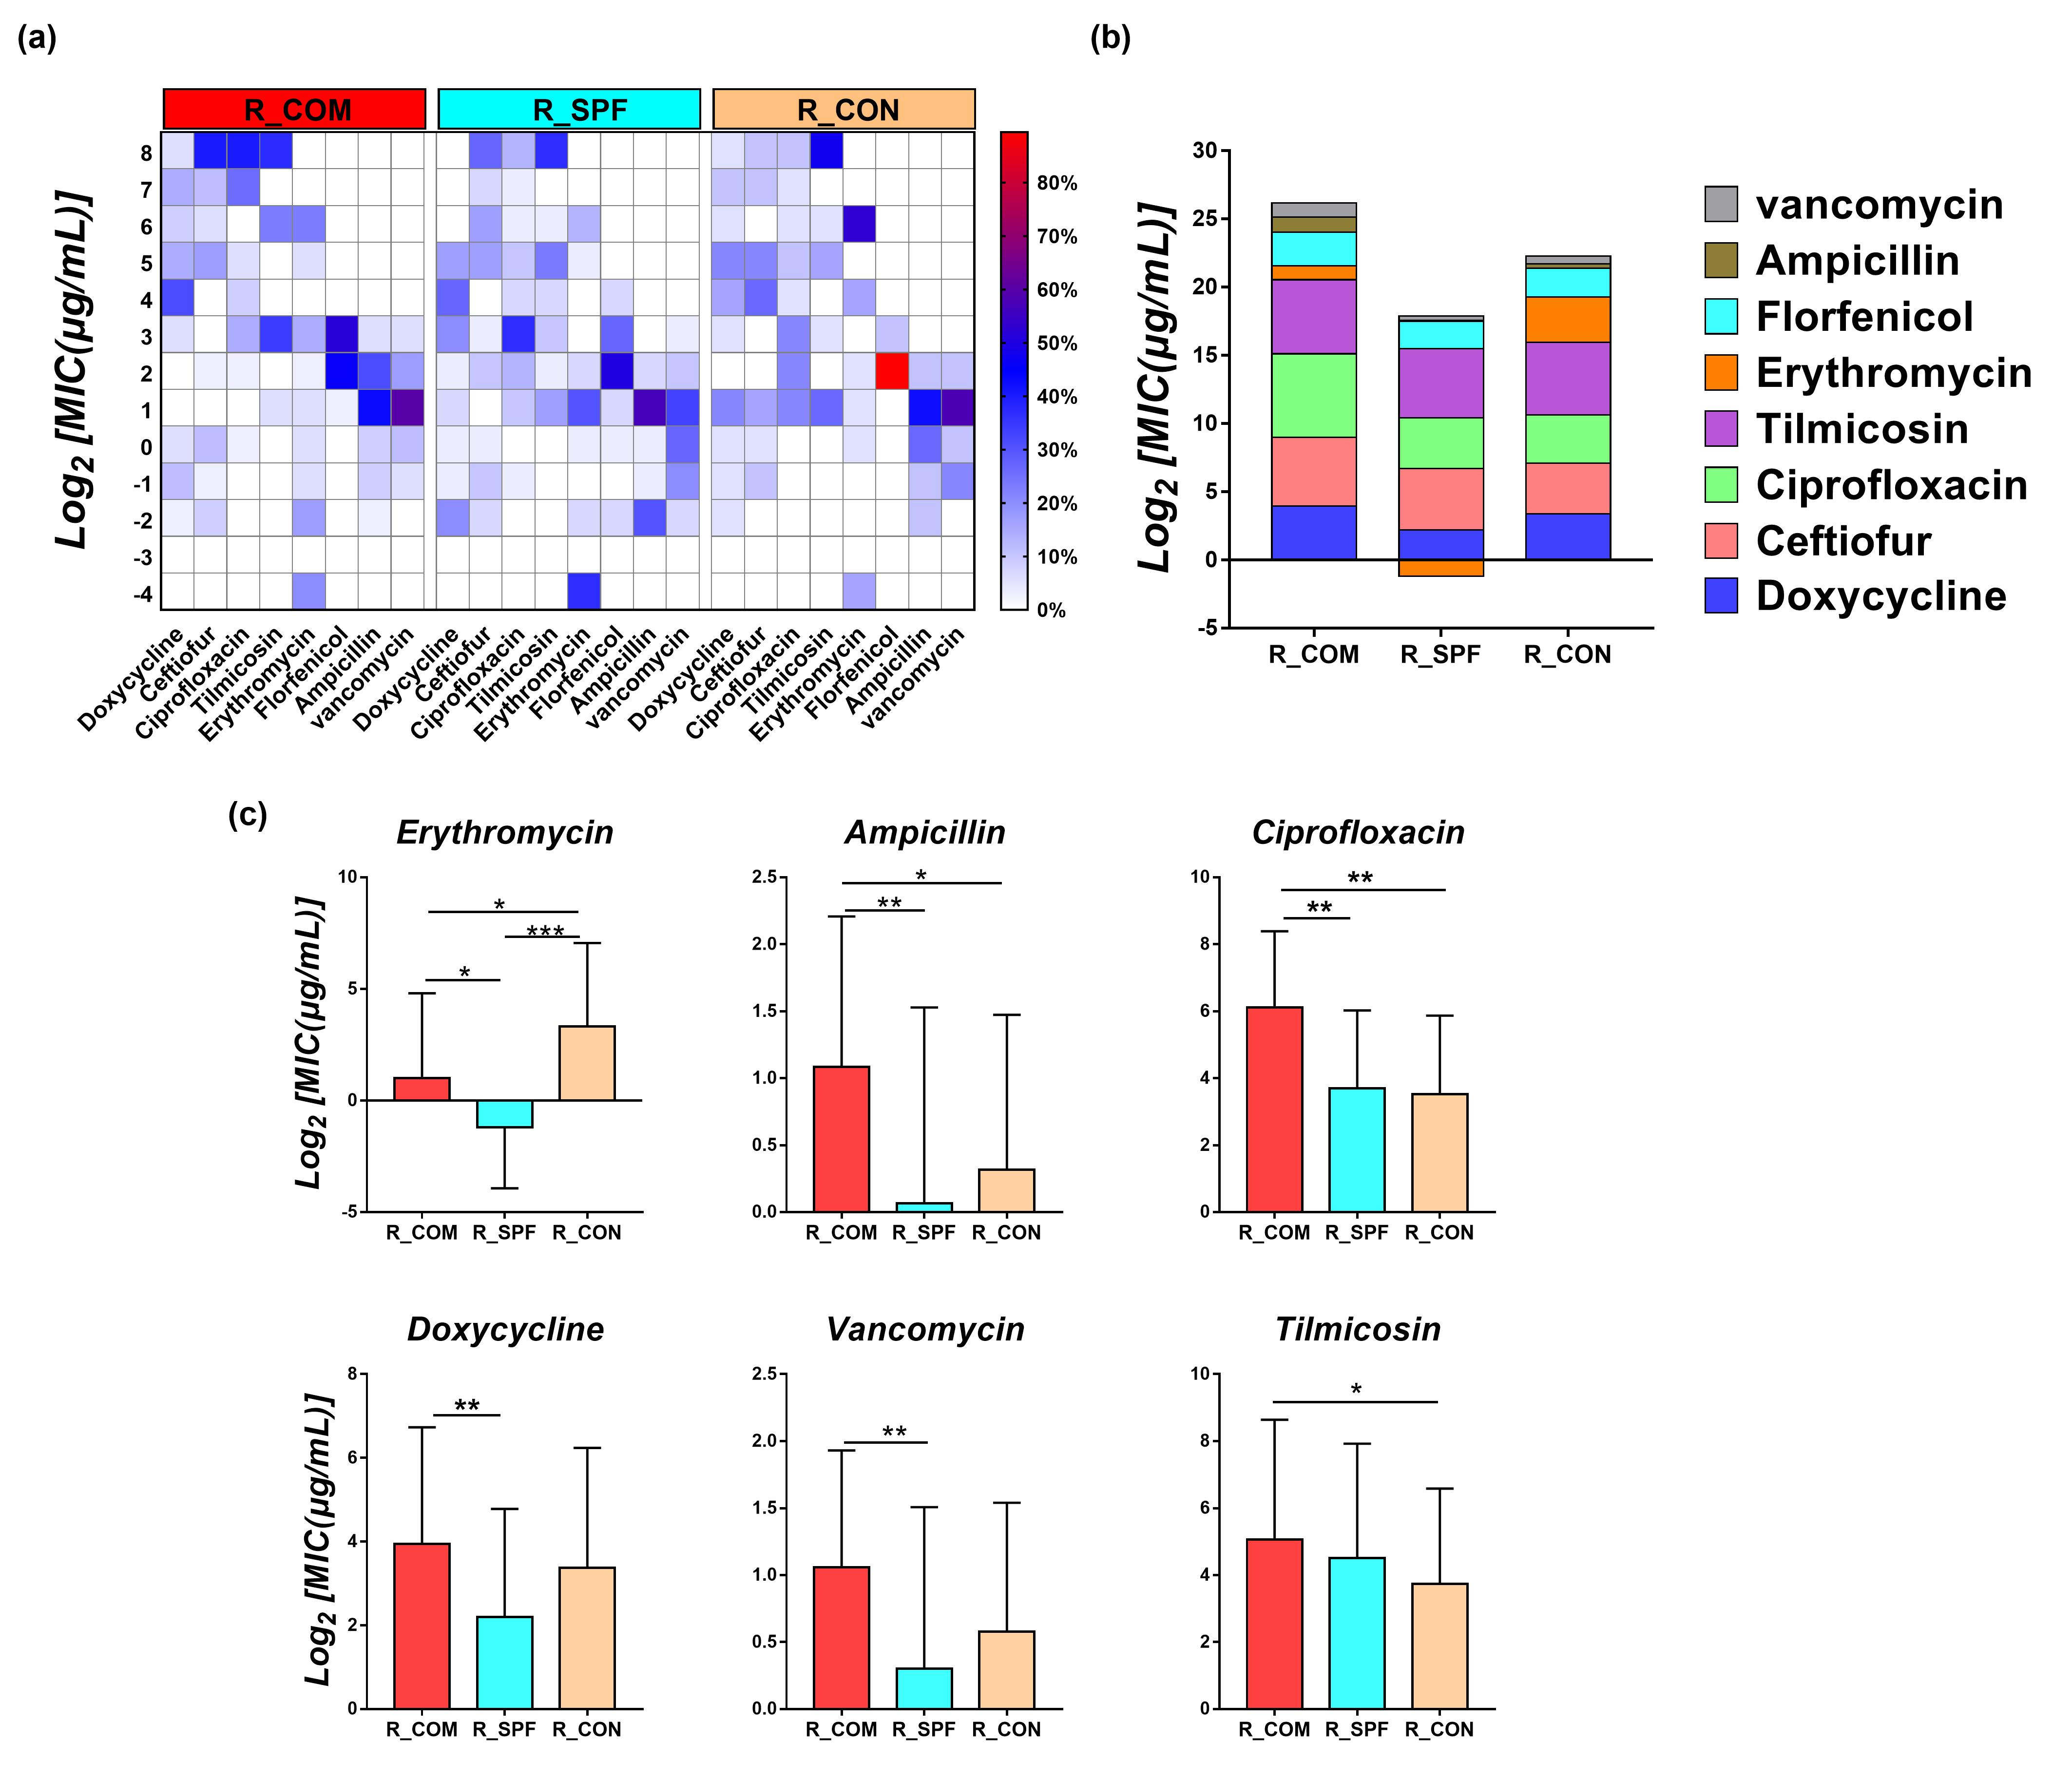
To measure bacterial antibiotic resistance of donor chicken, firstly, AST was performed to determine the MIC of selected antibiotics to Escherichia coli and Enterococcus faecium isolated from donor chicken cecum. The AST results showed that the MIC of Ampicillin, Florfenicol, Neomycin, Ceftiofur, Meropenem and Doxycycline to Escherichia coli isolated from donor SPF chicken, was significantly lower than that of Commercial chicken (Mann Whitney test, P < 0.05; Fig. S2a, b). Similar to Escherichia. Coli AST results, the MIC of Florfenicol, Erythromycin, Tilmicosin, Ampicillin and Vancomycin to Enterococcus. faecium isolated from donor SPF chicken, was significantly lower than that of Commercial chicken, while Ciprofloxacin was higher in SPF chicken (Mann Whitney test, P < 0.05; Fig. S2c, d). To globally reveal bacterial antibiotic resistance of donor chicken. HT-qPCR was performed to investigate the abundance and diversity of ARGs in chicken. The results showed that the relative copy number of ARGs was different. ARGs conferring resistance to Tetracycline and Sulfonamide were present at higher relative abundance in commercial chicken compared with SPF chicken, whereas MLSB, Aminoglycoside, β-Lactamase and Chloramphenicol were higher in SPF chicken (Mann Whitney test, P < 0.05; Fig. S2e, f).
FMT increased gut microbiota richness of recipient chicken
As the two FMT donor groups showed a significant difference in gut microbiota (Fig. S1), we next investigated the effect of FMT on the gut microbiota of recipient chickens. After FMT, we detected the gut microbiota of recipient chickens on 1, 5, 10, 20 and 30 days post FMT. Comparing with the control group (R_CON), FMT increased the richness of gut microbiota of FMT recipient chickens, which could even be observed 1 day post FMT (1 dpt) (Fig. 1a). While at the time point of 20 and 30 dpt, the microbiota richness of the two FMT recipient groups were similar to that of two donor groups, the group receiving SPF chicken microbiota (R_SPF) had a lower microbiota richness than the group receiving SPF chicken microbiota (R_COM) (Fig. S1a; Fig. 1a). Although, the microbiota richness of three recipient groups were different, the degree of variation in OTU richness within each recipient group was decreasing with chicken age, indicating that the microbiota richness within a group became more stable with chicken age (Fig. 1b). The quantitative statistics of shared OTU between groups showed that there were more shared OUT between the two groups receiving FMT and their corresponding donors (320–613), while the control group shared less OTU with the two groups receiving FMT or donor groups (267–320 ) (Fig. 1c). In addition, OTU correlation analysis showed that there was a significant correlation between the two groups receiving FMT and the corresponding donors at 5 time points, and the correlation became higher with the increase of chicken day-age, while the correlation between the control group and the two donor group was weak (Fig. 1d), suggesting that the microbiota colonization rate of FMT groups was increasing continuously with chicken day-age.
FMT shaped the distinct gut microbiota of recipient chicken
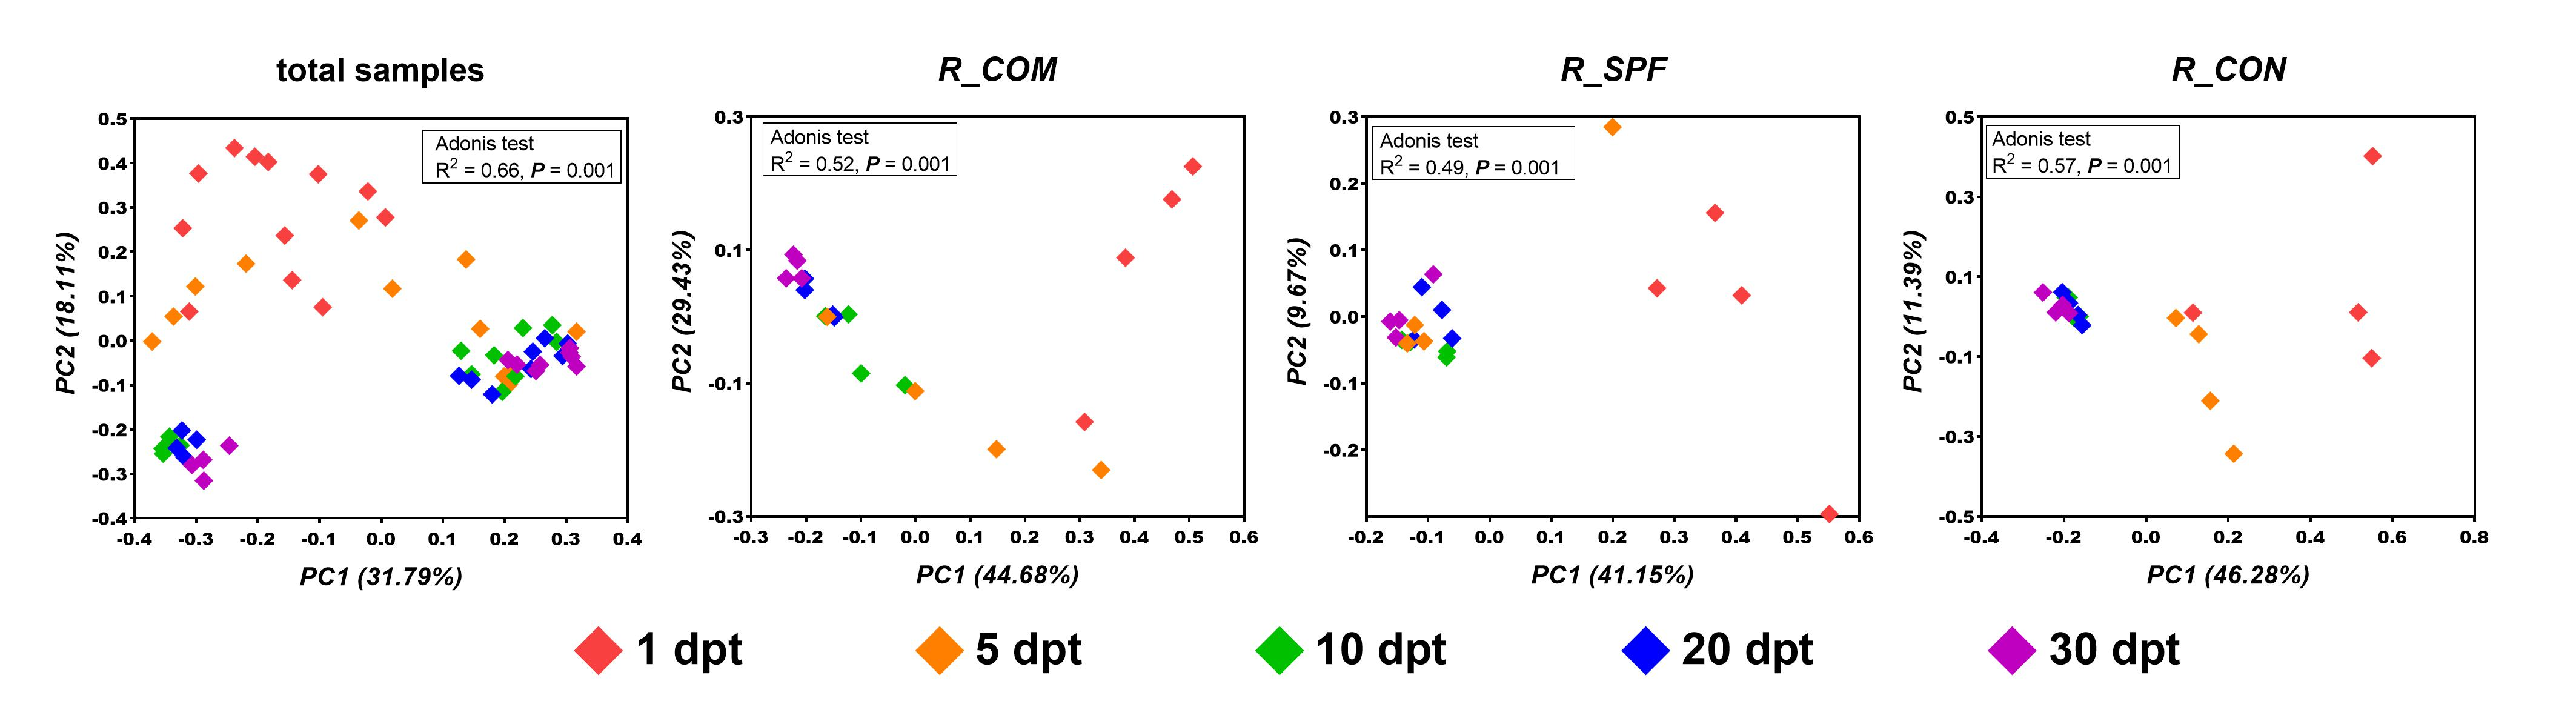
Principal coordinate analysis (PCoA) of Unweighted UniFrac distance revealed that the gut microbiota of three recipient groups formed three distinct clusters in 1, 5, 10, 20, 30 days post FMT (Fig. 2a), suggesting that the gut microbiota similarity between individuals within a test group was significantly higher than among inter-groups. In addition, PCoA using total samples or samples in each recipient group showed that the chicken day-age affected the dynamics of gut microbiota (Fig. S3). However, PCoA results showed that samples of chicken in 1 and 5 days post FMT could be divided into two clusters, while 5 and 10 days could not (Fig. 2a, c), which suggested that chicken day-age could be as a factor to distinguish different microbiota in 1–5 days post FMT, but can not in 5–10 days post FMT. And the Fig. 2b, d showed that the effect of chicken day-age on the dynamics of gut microbiota is less than that of FMT, moreover, the effect of FMT is increasing with the chicken day-age (Fig. 2).
The analysis of similarities of weighted UniFrac distances further indicated that FMT made the gut microbiota more convergent in 1 day post FMT (Fig. 3a). Moreover, with the increase of chicken day-age, the similarity of chicken gut mcirobiota among individuals within a group became higher and the microbiota structure tended to be stable at 10 days post FMT (Fig. 3b). FMT caused shifts from recipient to their corresponding donor in chicken gut microbiota (Fig. 3c). The gut microbiota similarity between FMT recipient chicken and the corresponding donor reached the maximum at 30 days post FMT (Fig. 3d). These results suggested that initial exposure to microbiota had a determining role in shaping the gut microbiota profiles at a later stage of life.