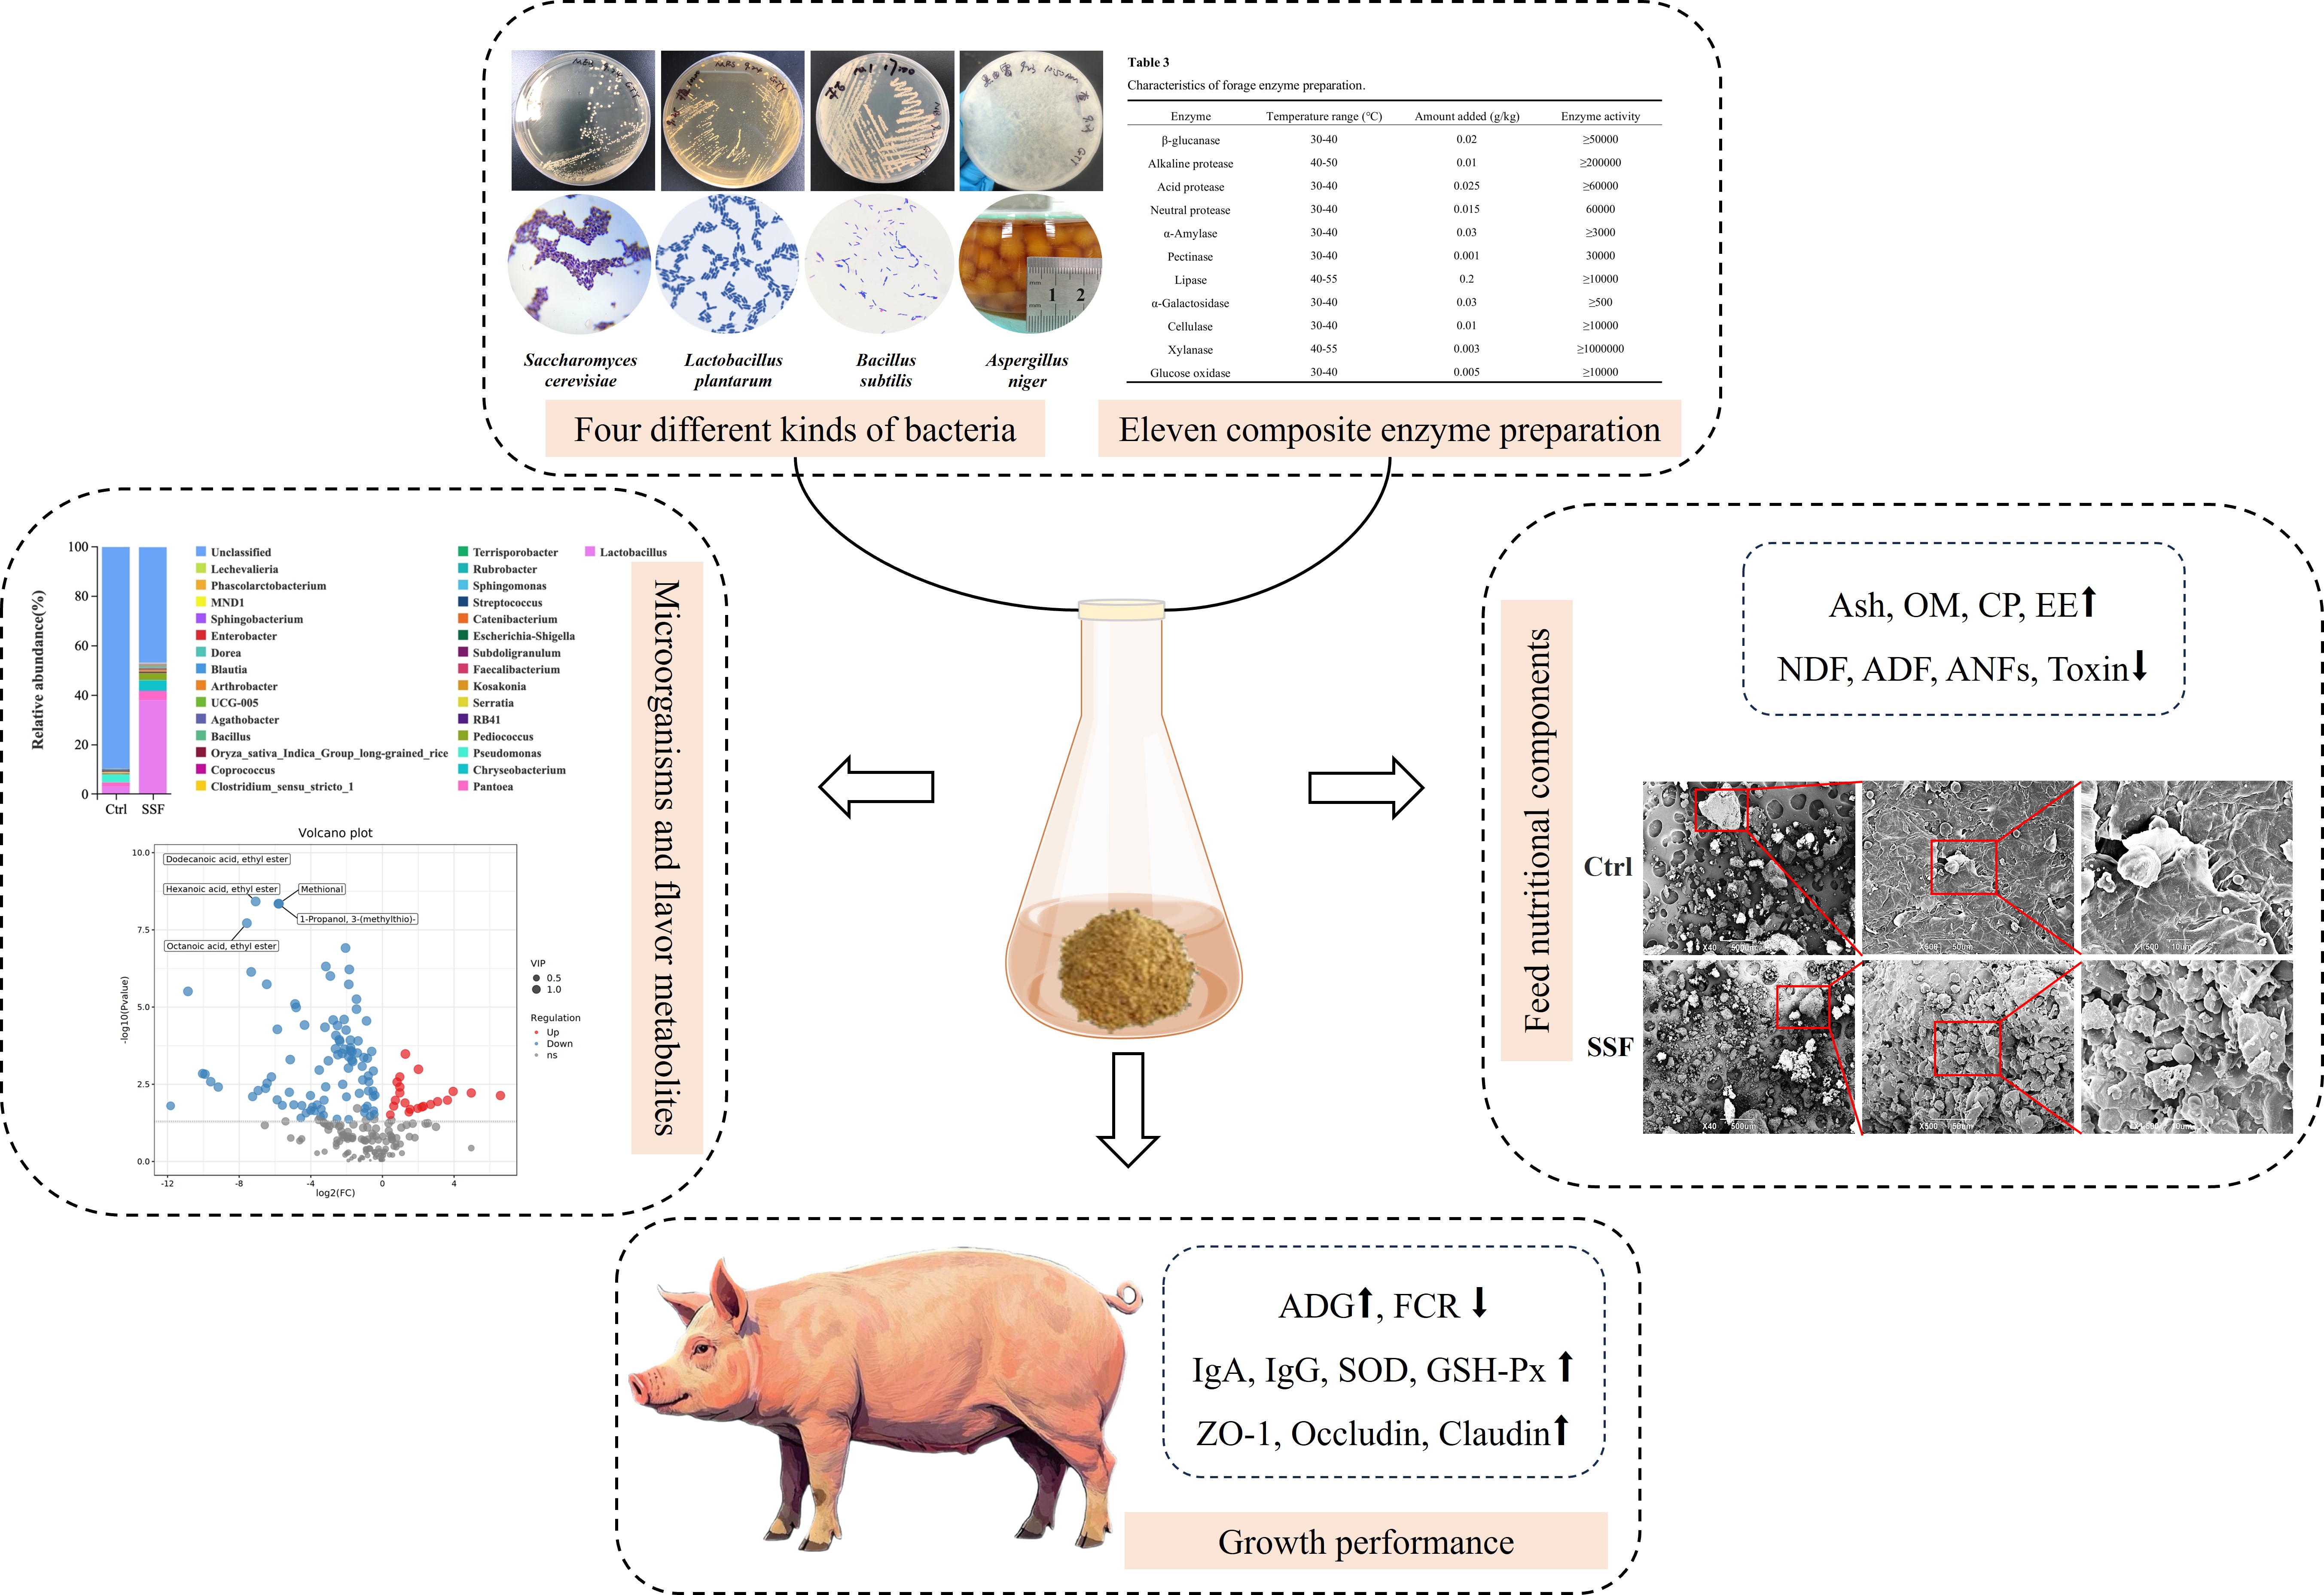
Establishment of solid-state fermented (SSF) feed process
The Lactobacillus plantarum (L. Plantarum, BNCC336421) and Bacillus subtilis (B. Subtilis, BNCC109047) used in the experiment were purchased from Bena Culture Collection, while Saccharomyces cerevisiae (S. Cerevisiae, CICC1355) and Aspergillus niger (A. niger, CICC40273) were obtained from the China Center of Industrial Culture Collection. After each microbial strain was activated, optimization and screening were carried out based on the orthogonal experiment (Table 1), with trichloroacetic acid-soluble protein (TCA-SP), CF, and the anti-nutritional factor β-conglycinin as the evaluation indicators. Subsequently, through single-factor and response surface optimization experiments (Table 2), the optimal microbial ratios were conducted to investigate the effects of different fermentation times (1 day, 2 days, 3 days, 4 days, 5 days, and 6 days), fermentation temperatures (24°C, 28°C, 32°C, 36°C, and 40°C), water content (60%, 80%, 100%, 120%, and 140%), and microbial inoculation levels (6%, 9%, 12%, 15%, and 18%) on the TCA-SP and CF content in fermented feed. Thoroughly dissolve the compound enzyme preparation and mix it uniformly into the feed. Then, subject the mixture to bacteria-enzyme synergistic fermentation under optimized conditions using the refined mixed-strain ratio to produce SSF feed. The characteristics of the compound enzyme preparation are presented in Table 3, and the nutritional composition and levels of the basal diet are shown in Table 4. All experiments were conducted with three biological replicates.
Table 1
Orthogonal test factors and levels design table of L9 (34) for strains proportion
Level | Factors |
|---|
(A) B. subtilis | (B)L. plantarum | (C) S. cerevisiae | (D) A. niger |
|---|
1 | 1 | 1 | 1 | 1 |
2 | 2 | 2 | 2 | 2 |
3 | 3 | 3 | 3 | 3 |
Table 2
Design of RSM experimental factors and levels
Factor | Levels |
|---|
-1 | 0 | 1 |
|---|
A Inoculum quantity(%) | 6 | 9 | 12 |
B Moisture content(%) | 60 | 80 | 100 |
C Time(d) | 3 | 4 | 5 |
Table 3
Characteristics of forage enzyme preparation
Enzyme | Temperature range (℃) | Amount added (g/kg) | Enzyme activity |
|---|
β-glucanase | 30–40 | 0.02 | ≥ 50000 |
Alkaline protease | 40–50 | 0.01 | ≥ 200000 |
Acid protease | 30–40 | 0.025 | ≥ 60000 |
Neutral protease | 30–40 | 0.015 | 60000 |
α-Amylase | 30–40 | 0.03 | ≥ 3000 |
Pectinase | 30–40 | 0.001 | 30000 |
Lipase | 40–55 | 0.2 | ≥ 10000 |
α-Galactosidase | 30–40 | 0.03 | ≥ 500 |
Cellulase | 30–40 | 0.01 | ≥ 10000 |
Xylanase | 40–55 | 0.003 | ≥ 1000000 |
Glucose oxidase | 30–40 | 0.005 | ≥ 10000 |
Table 4
Nutrient composition and nutrient level of basal diet.
Ingradient | Contents (%) | Nutrient levels 1) | Contents (%) |
|---|
Corn | 67.45 | DM | 92.30 |
Whey powder | 3.00 | Water | 7.70 |
Soybean oil | 1.23 | CP | 18.36 |
Soybean | 20.61 | EE | 4.10 |
Fish meal | 2.00 | Ash | 6.87 |
Lysine hydrochloride | 0.55 | ADF | 15.88 |
Met(98%) | 0.23 | NDF | 7.38 |
Thr(98%) | 0.23 | Ca | 0.69 |
Trp(98%) | 0.08 | Total Phosphorus | 0.65 |
Limestone | 0.48 | Lys | 1.20 |
CaHPO4 | 1.57 | Met + Cys | 0.71 |
NaCl | 0.56 | Thr | 0.76 |
Premix 2) | 2.00 | Trp | 0.24 |
Total | 100.00 | | |
Met = Methionine; Thr = Threonine; Trp = Tryptophan; DM = Dry Matter; CP = Crude Protein; EE = Ether extract; ADF = Acid detergent fiber; NDF = Neutral detergent fiber; CA = Crude Ash; Lys = Lysine; Cys = Cystine.
1) Water, CP, EE, Ash, NDF and ADF were measured values, the others were calculated values.
2) Premix provided per kilogram of diet: Vitamin A 10000 IU; Vitamin D 3500 IU; Vitamin E 70 IU; Vitamin K3 3 mg; Vitamin B1 3 mg; Vitamin B2 10 mg; Vitamin B6 6 mg; biotin 0.4 mg; pantothenate acid 30 mg; niacin 30 mg; Cu 110 mg (as copper sulfate); Mn 10 mg (as manganese sulfate); Fe 140 mg (as ferrous sulfate); I 0.5 mg (as potassium iodide); Se 0.3 mg (as sodium selenite).
Determination of feed nutritional value
The SSF feed was taken out from the incubator, ground into fine powder after being dried in an oven at 65°C for over 48 hours, and then stored sealed at 4°C for later use. Following the methods of previous studies[17, 18], the feed was analyzed for crude protein (CP), ether extract (EE), ash, and neutral detergent fiber (NDF), while also determining the content of acid detergent fiber (ADF) and trichloroacetic acid-soluble protein (TCA-SP). The contents of soybean globulin (YJ820239), trypsin inhibitor (TI, YJ820238), β-conglycinin (YJ831129), phytohemagglutinin (PHA, YJ854229), deoxynivalenol (DON, ml103502), zearalenone (ZEN, ml036116), aflatoxin B1 (AFB1, ml036115), and T-2 toxin (TS, ml036120) were determined according to the manufacturer's instructions (Shanghai Enzyme-Linked Biotechnology Co., Ltd., China).
Determination of small peptides and analysis by electron microscopy
Gently pick up feed sample particles with tweezers and lay them flat on the operating plate for observation of different fields of view of the feed morphology under a scanning electron microscope. Additionally, add the denatured feed to a protein gel for electrophoresis, followed by staining and destaining with Coomassie brilliant blue dye.
16S rDNA sequencing
16S rDNA sequencing was performed on the basal feed and SSF feed. After DNA extraction from the samples, a library was constructed and sequenced on the Illumina PE250 platform. The DADA2 software was used for data assembly, read filtering, redundancy removal, denoising, and chimera elimination. After generating ASVs (Amplicon Sequence Variants), species annotation was conducted based on sequence information. The annotation results were visualized using KRONA, and sequence counts at the phylum and genus levels were tallied. Alpha diversity indices, including observed_species (Sob), Chao1, Shannon, and Pielou, were analyzed using QIIME software. Beta diversity was assessed using the weighted UniFrac algorithm to analyze differences among microbial communities in different groups, with results displayed in a Principal Coordinates Analysis (PCoA) plot. Venn diagram analysis was conducted using the vegan package in R, followed by intergroup difference analysis using the LEfSe software. Functional annotation and community function prediction were performed using the Tax4Fun software. The OTU abundance table was combined with the “species-gene” network to output the relative functional abundance for each sample (NCBI: PRJNA1275368).
Flavor metabolomics analysis
The 1 g sample was mixed with 10 µL of internal standard solution and incubated at 60°C for 30 minutes. The Solid-Phase Microextraction (SPME) fiber was aged at 270°C for 10 minutes, then placed in the incubation chamber. After adsorption at 60°C for 30 minutes, the SPME fiber was inserted into the injection port (desorbed at 250°C for 5 minutes) and then aged again at 270°C for 10 minutes. The injection volume was 10 µL, with an injection temperature set at 250°C and a constant helium flow rate of 1.0 mL/min. Detection was performed using the GC × GC-TOFMS chromatography system (LECO, St. Joseph, MI, USA). The scan range was set at m/z 35–550, with the transfer line and ion source temperature maintained at 250°C, an acquisition rate of 200 spectra/second, an electron impact energy of 70 eV, and a detector voltage of 2019 V. Continuous scan MS data were collected to generate total ion current (TIC) chromatograms. The data were processed using ChromaTOF software, which is specifically designed for advanced chromatography and mass spectrometry data analysis, providing features such as NonTarget Deconvolution and library searches. Flavor compounds were annotated using the ChromaTOF search software, and the numbers and relative abundances of various flavor compounds were analyzed. The flavor profiles of the samples were evaluated using relative odor activity values (ROAV), and sensory flavor analysis was performed using the FlavorDB database. Principal component analysis (PCA) was conducted on the metabolites, and volcano plots were used to visually display the distribution of differential metabolites between the two sample groups. A network relationship among flavor compounds was constructed using the igraph package based on the FlavorDB database (NGDC: OMIX011743).
RNA-seq
In this study, total RNA was extracted from the rapidly frozen longissimus dorsi muscle using the Trizol method and assessed for purity with the NanoDrop ND-2000 (Thermo Fisher Scientific, Wilmington, DE) and validated for integrity with the Agilent 2100 Bioanalyzer. Stranded mRNA libraries were constructed using the Illumina TruSeq Stranded mRNA LT Kit and sequenced on the NovaSeq 6000 platform with 150 bp paired-end reads. Raw data underwent quality control with fastp to filter out low-quality data, yielding clean reads. These reads were then aligned to the reference genome using HISAT 2. Gene expression levels were quantified using Stringtie to reconstruct transcripts and RSEM to calculate expression levels across all genes in each sample. Differentially expressed genes (DEGs) were identified based on criteria of FDR < 0.05 and |log2FoldChange| ≥ 1. Subsequently, Kyoto Encyclopedia of Genes and Genomes (KEGG) pathway analysis was conducted using the online platform I-Sanger (NCBI: PRJNA1282860).
Experimental animal management
This study selected 48 Duroc × Jinfen White pigs with a body weight of 17.87 ± 2.83 kg at 60 ± 3 days of age. The pigs were randomly divided into two groups, each with 4 replicates per group and 6 pigs per replicate (an equal number of males and females): the control (Ctrl) group and the SSF group. The Ctrl group was fed a basal feed, while the SSF group was fed a diet supplemented with 10% SSF feed. After a 5-day adaptation period, the feeding trial lasted for 28 days. During the trial, the temperature and relative humidity inside the pig house were regularly monitored and recorded. The remaining feed and the amount of feed added were cleared and recorded every morning at 8:00, with free access to water throughout the period.
Measurement of growth performance and sample collection
Individuals participating in the experiment were weighed at the beginning and end of the trial, and daily feed intake per pen was recorded. These data were used to calculate average daily gain (ADG), average daily feed intake (ADFI), and feed conversion ratio (FCR). Blood samples were collected from each pig via jugular vein before the end of the trial, and serum was separated. The longissimus dorsi muscle was collected from the left side of the carcass, between the 13th and 16th lumbar vertebrae, after slaughter, for the measurement of meat color, shear force, drip loss, and pH value. Sections of the duodenum, jejunum, ileum, and mid-colon were gently washed in pre-cooled sterile saline or PBS and then placed in 4% paraformaldehyde fixative. The remaining tissue samples were immediately frozen in liquid nitrogen and stored at -80°C.
Immune biochemistry and enzyme-linked immunosorbent assay (ELISA)
Conventional nutritional indicators such as total protein, albumin, globulin, blood glucose, and urea nitrogen were measured using an automatic biochemical analyzer (IDEXX, USA). ELISA kits for detecting interleukin-4 (IL-4, YJ31752), interleukin-6 (IL-6, YJ35656), interleukin-10 (IL-10, YJ31974), and tumor necrosis factor-α (TNF-α, YJ31476) in serum were purchased from Shanghai Enzyme-Linked. Malondialdehyde (MDA, A003-1-2), catalase (CAT, A007-1-1), total antioxidant capacity (T-AOC, A015-2-1), superoxide dismutase (SOD, A001-3-2), and glutathione peroxidase (GSH-PX, A005-1-2) were measured using biochemical assay kits from Nanjing Jiancheng.
Histological evaluation
The fixed intestinal tissues were dehydrated using an ASP-200 (Leica, Germany). Tissue sections with a thickness of 5 µm were obtained using a rotary microtome (Leica, Germany), following a previously reported protocol [19]. The tissue sections were stained with hematoxylin-eosin, and images were captured using the EVOSFL Auto Cell Imaging System software. Chorion length, crypt depth, and chorion height/crypt depth ratios were calculated using Image-Pro Plus 6.0 software.
Statistical analysis
In this experiment, data were processed using SPSS20.0. An independent samples T-test was used to analyze the data, and the results were expressed as "mean ± SEM". Statistical significance was indicated by a p-value of less than 0.05.