Data Recovery
From June 2020 to October 2024, 125 cobia were conventionally dart-tagged off the coast of Texas, USA, ranging in size from 432 mm (17.0 in) to 1302 mm FL (51.3 in), with a mean (± SD) of 820 ± 175 mm FL. Of these, 72% (90 of 125) were below the legal minimum size limit of 914 mm (36 in) FL. Eleven tagged cobia were recaptured and reported, yielding a recapture rate of 8.8% (11 of 125). Among the recaptured fish, five exceeded the minimum size limit and were harvested, while one (Fish 21), also above the limit, was voluntarily released by the angler upon noticing the mrPAT tag.
Thirty-four cobia were also PAT-tagged and ranged in size from 699 mm FL (27.5 in) to 1112 mm FL (43.8 in), with a mean of 938 ± 106 mm FL (Table 1). Due to the size requirements for PAT tag deployments, 65% (22 of 34) of these individuals exceeded the legal minimum size limit. Fight times for PAT-tagged individuals ranged from 0.5 to 6.0 min (mean = 2.8 ± 1.6 min), and handling times ranged from 2 to 8 min (mean = 3.8 ± 1.4 min). All PAT-tagged cobia exhibited shallow hooking locations (i.e., visibly hooked in the mouth or jaw).
Of the 34 PAT tags deployed (6 MiniPATs, 11 sPATs, and 17 mrPATs), 28 successfully transmitted data, while six mrPATs failed to report (DNR; Table 1). Five PAT tags (4 MiniPATs and 1 sPAT) were physically recovered, providing the entire archived time series. Among the 28 tags that transmitted data, 15 released on schedule, whereas 13 detached prematurely due to predation (Fish 12), angler harvest (Fish 15), or tag attachment failure (TAF; n = 11). PAT tags experiencing TAF reported specific release reasons, including “Floater” or “Pin Broke,” leading to early transmissions and reduced deployment durations (mean = 41% ± 32% of the scheduled deployment period). Floater indicated the tag and tether assembly detached from the fish and surfaced, triggering the tag’s pre-configured conditional release parameters. Pin Broke indicated that the tag detected a broken release pin and surfaced, likely due to external forces exerted on the tether (e.g., entanglement with underwater structures or human interference). Two TAFs occurred within the first 10 d after tagging, including one mrPAT (Fish 21) that detached on the same day the fish was recaptured and released by an angler after one day at liberty. Although the angler released the fish with the mrPAT tag still attached, the tag transmitted later that day, suggesting that the recapture event may have triggered its premature detachment, either as a potential PRM or TAF. Another cobia (Fish 24) tagged with a mrPAT on 21 October 2021 was recaptured on 8 October 2022, also nearly one year after being tagged. The mrPAT completed its 103-d deployment, releasing on schedule on 1 February 2022, and its tether remained attached when the fish was recaptured in October 2022.
Table 1
Summary of pop-up archival transmitting (PAT) tag deployments on cobia in the northwestern Gulf of Mexico.
Fish ID | FL (mm) | Tag Model | Tagging Location | Tagging Date | Pop-up Date | Pop-up Location | DAL | Release Reason |
|---|
1 | 945 | sPAT | 27.64°N, 97.01°W | 17 Jun 2020 | 10 Aug 2020 | 27.73°N, 96.89°W | 54 | TAF – Pin Broke |
2a | 1035 | MiniPAT | 27.39°N, 97.08°W | 04 Aug 2020 | 12 Oct 2020 | 27.67°N, 96.92°W | 69 | TAF – Floater |
3 | 895 | mrPAT | 27.75°N, 96.99°W | 06 Aug 2020 | 15 Sep 2020 | 27.52°N, 97.23°W | 40 | TAF – Floater |
4 | 1092 | mrPAT | 27.92°N, 96.65°W | 07 Sep 2020 | | | | DNR |
5 | 838 | mrPAT | 27.79°N, 96.96°W | 16 Sep 2020 | | | | DNR |
6 | 865 | mrPAT | 27.66°N, 97.17°W | 25 Sep 2020 | 15 Oct 2020 | 26.23°N, 97.17°W | 20 | TAF – Floater |
7b | 898 | MiniPAT | 27.79°N, 96.96°W | 01 Oct 2020 | 30 Mar 2021 | | 180 | Scheduled |
8 | 916 | mrPAT | 28.07°N, 96.77°W | 01 Oct 2020 | 27 Nov 2020 | 28.14°N, 96.59°W | 57 | Scheduled |
9 | 925 | mrPAT | 27.83°N, 97.02°W | 01 Oct 2020 | 18 Dec 2020 | 26.64°N, 96.82°W | 78 | Scheduled |
10 | 923 | mrPAT | 27.83°N, 97.02°W | 01 Oct 2020 | 04 Dec 2020 | 27.78°N, 96.53°W | 64 | Scheduled |
11a | 925 | MiniPAT | 27.65°N, 97.13°W | 13 Oct 2020 | 11 Apr 2021 | 27.60°N, 97.19°W | 180 | Scheduled |
12a | 990 | MiniPAT | 27.64°N, 97.13°W | 13 Oct 2020 | 20 Oct 2020 | 27.64°N, 97.13°W | 1 | M – Predation |
13a | 1067 | MiniPAT | 27.62°N, 97.13°W | 13 Oct 2020 | 20 Nov 2020 | 26.89°N, 97.35°W | 38 | TAF – Pin Broke |
14 | 995 | sPAT | 27.75°N, 96.99°W | 14 Oct 2020 | 13 Dec 2020 | 26.58°N, 97.17°W | 60 | Scheduled |
15 | 1090 | mrPAT | 27.71°N, 97.03°W | 14 Oct 2020 | 19 Oct 2020 | 27.60°N, 97.08°W | 5 | M – Harvested |
16 | 867 | mrPAT | 27.79°N, 96.96°W | 14 Oct 2020 | 12 Feb 2021 | 25.98°N, 96.71°W | 121 | Scheduled |
17 | 865 | mrPAT | 27.82°N, 97.01°W | 14 Oct 2020 | | | | DNR |
18 | 860 | mrPAT | 27.64°N, 97.15°W | 04 Oct 2021 | | | | DNR |
19 | 1035 | mrPAT | 27.64°N, 97.15°W | 04 Oct 2021 | | | | DNR |
20 | 927 | mrPAT | 27.62°N, 97.13°W | 04 Oct 2021 | | | | DNR |
21 | 918 | mrPAT | 27.70°N, 97.09°W | 07 Oct 2021 | 08 Oct 2021 | 27.91°N, 96.92°W | 1 | TAF – Floater |
22c | 1086 | mrPAT | 27.70°N, 97.09°W | 07 Oct 2021 | 15 Feb 2022 | | 131 | Scheduled |
23 | 972 | mrPAT | 27.62°N, 97.13°W | 21 Oct 2021 | 01 Feb 2022 | 26.46°N, 96.81°W | 103 | Scheduled |
24 | 965 | mrPAT | 27.62°N, 97.13°W | 21 Oct 2021 | 01 Feb 2022 | 26.17°N, 96.83°W | 103 | Scheduled |
25d | 1054 | MiniPAT | 27.71°N, 97.09°W | 21 Oct 2021 | 16 Nov 2021 | | 26 | TAF |
26 | 967 | sPAT | 27.82°N, 96.85°W | 06 Aug 2024 | 05 Oct 2024 | 28.08°N, 96.38°W | 60 | Scheduled |
Table 1
Fish ID | FL (mm) | Tag Model | Tagging Location | Tagging Date | Pop-up Date | Pop-up Location | DAL | Release Reason |
|---|
27a | 1029 | sPAT | 28.04°N, 96.34°W | 06 Aug 2024 | 19 Sep 2024 | 26.43°N, 97.02°W | 44 | TAF – Floater |
28 | 1003 | sPAT | 27.64°N, 97.14°W | 16 Sep 2024 | 15 Nov 2024 | 27.35°N, 97.27°W | 60 | Scheduled |
29 | 756 | sPAT | 28.18°N, 96.60°W | 01 Oct 2024 | 23 Nov 2024 | 25.81°N, 97.15°W | 53 | TAF – Floater |
30 | 699 | sPAT | 28.20°N, 96.55°W | 01 Oct 2024 | 30 Nov 2024 | 28.30°N, 95.99°W | 60 | Scheduled |
31 | 756 | sPAT | 28.08°N, 96.72°W | 01 Oct 2024 | 26 Oct 2024 | 21.61°N, 97.36°W | 26 | TAF – Floater |
32 | 902 | sPAT | 28.07°N, 96.76°W | 01 Oct 2024 | 30 Nov 2024 | 26.58°N, 96.99°W | 60 | Scheduled |
33 | 731 | sPAT | 28.07°N, 96.76°W | 01 Oct 2024 | 06 Oct 2024 | 26.74°N, 97.34°W | 5 | TAF – Floater |
34 | 1112 | sPAT | 28.07°N, 96.76°W | 01 Oct 2024 | 30 Nov 2024 | 28.02°N, 96.40°W | 60 | Scheduled |
FL, fork length; DAL, days at liberty; TAF, tag attachment failure; DNR, did not report; M, mortality
aRecovered tag
bThe first Argos location was reported on the beach five days after the tag released on schedule
cNo reported Argos locations
dTag transmitted on schedule following a 180-d deployment period but experienced tag attachment failure for unknown reasons after
26 days at liberty
Post-Release Mortality
Post-release fate was inferred using data from the 28 reporting PAT tags. Fish 15 was harvested 5 d after tagging, as indicated by Argos-derived locations tracking toward land and later confirmed by the angler. This individual was not classified as a PRM, as it had resumed feeding prior to capture (i.e., it actively took a baited hook or lure). Fish 12’s MiniPAT tag was ingested within 1.5 h of release, as inferred from recovered archival depth, temperature, and light-level time series. Given the short time interval between release and predation, this event was classified as a PRM. The remaining 26 tagged cobia exhibited horizontal movements, depth, temperature, or tilt data consistent with survival.
PRM estimates varied depending on the calculation method. Using the first estimation approach (Eq. 1), which considered only the single predated individual (Fish 12), the PRM rate was 3.6% (95% CI: 0.0–10.7%) among the 28 transmitting PAT tags. The second, more conservative approach (Eq. 2) incorporated two TAFs (Fish 21 and 33) that occurred within the first 10 d after tagging and six tags that DNR classified as mortalities. Under this method, nine mortalities (1 PRM + 2 TAF + 6 DNR) were assumed from the 34 total PAT tag deployments, yielding a PRM rate of 26.5% (95% CI: 11.8–41.2%).
Horizontal Movements
Dispersal from the tagging area was evaluated for 21 of the 28 reporting PAT tags using quality pop-up locations from deployments > 10 d (Table 2). One mrPAT (Fish 22) did not report locations, while two MiniPATs (Fish 7 and 25) reported locations 5 and 154 d after tag detachment, respectively, and were thus excluded from dispersal calculations. Notably, Fish 25’s MiniPAT tag transmitted on schedule following a 180-d deployment period over the outer shelf off Georgia and South Carolina. However, a review of the transmitted depth time series revealed that this tag experienced TAF and started floating over the mid-shelf off Packery Channel, Texas, after 26 d based on maximum likelihood locations. Despite sensor data indicating a TAF event, technical support from the tag manufacturer (Wildlife Computers) could not determine the cause of the delayed transmission.
PAT tags released between mid-August and mid-April, with deployment durations ranging from 20–180 d (mean = 73 ± 43 d; Table 2). Seventeen individuals reported pop-up locations with mean dispersal distances of 173.4 ± 172.7 km (range = 8.6–719.6 km) south-southwest (n = 14) or 46.9 ± 10.3 km (range = 35.8–56.2 km) east (offshore; n = 3) from their original tagging location between September and April. Four individuals exhibited northeastward movements, with mean dispersal distances of 30.7 ± 17.8 km (15.2–54.4 km) between August and November.
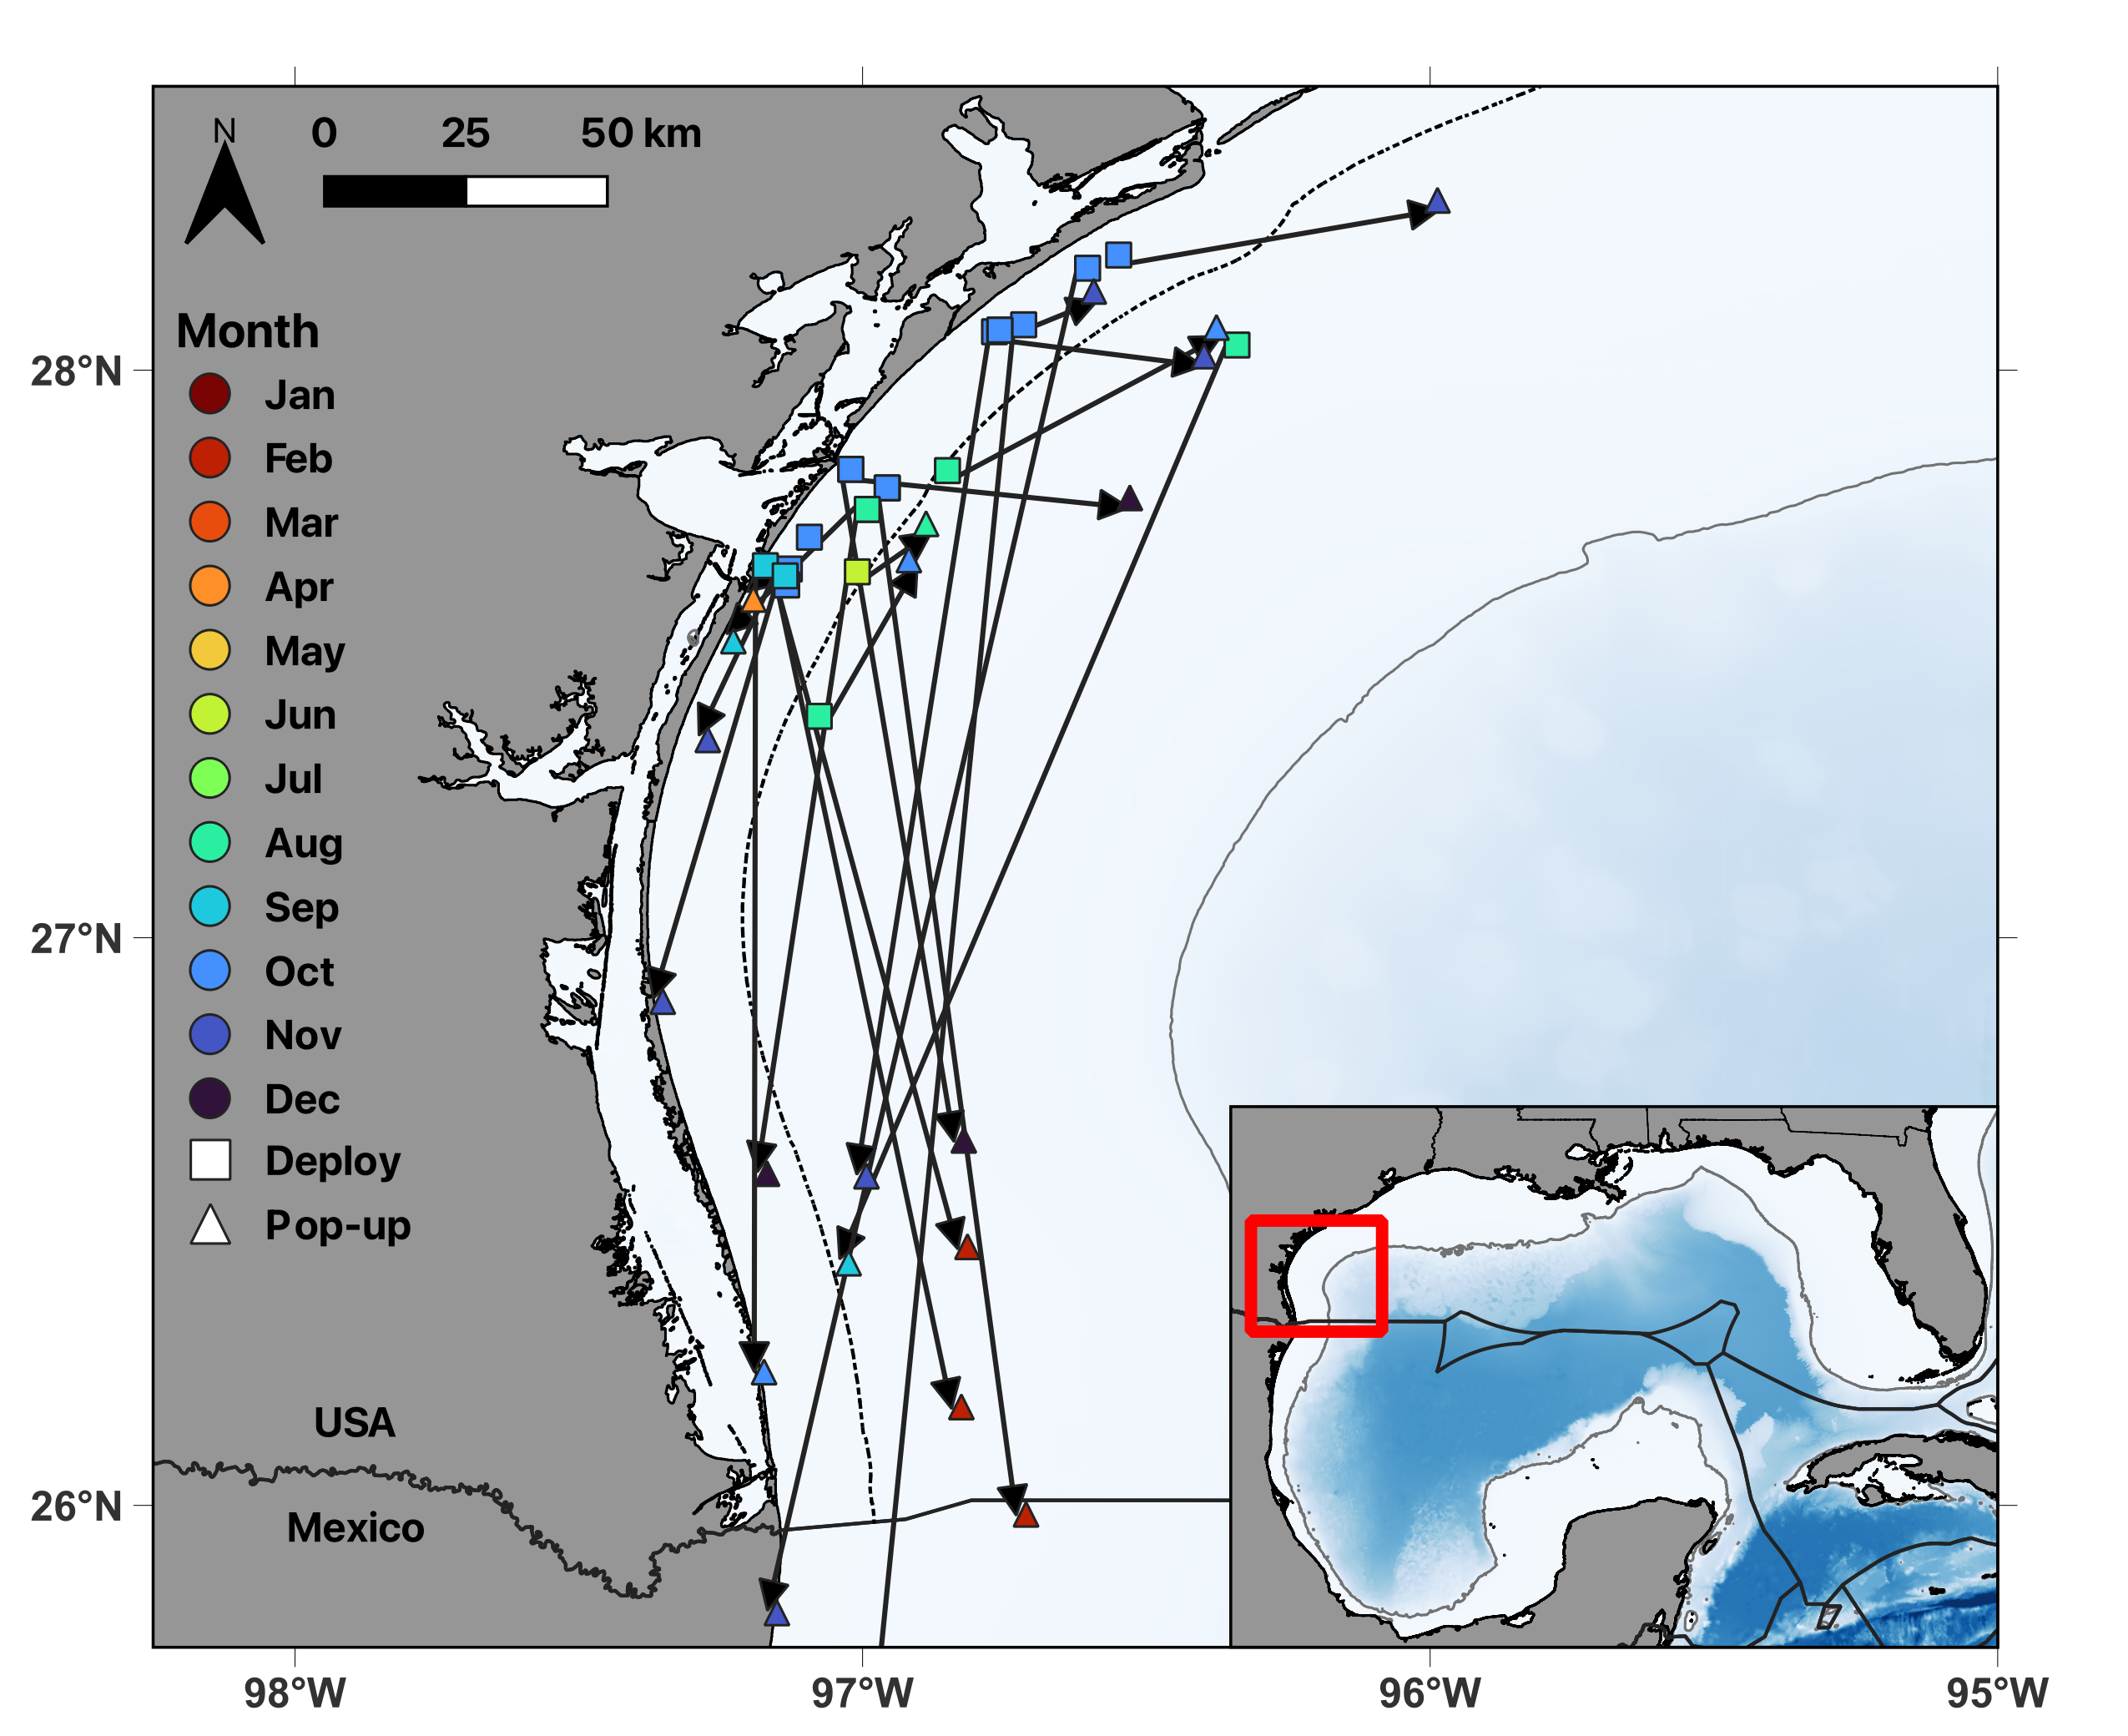
Three PAT tags (Fish 16, 29, and 31) reported pop-up locations in Mexican waters, including one mrPAT (Fish 31) releasing 719.6 km south of its tagging location off Cabo Rojo on the Tamaulipas-Veracruz shelf. One PAT tag (Fish 16) released only 2.7 km into Mexican waters, though it is likely that the fish was still in U.S. waters at the time of release, as the first successful Argos transmission occurred approximately 11 h later, exhibiting a strong southward drift trajectory based on subsequent Argos locations. Seven additional PAT tags (Fish 6, 9, 14, 23, 24, 27, and 32) reported 18.3–70.3 km north of the U.S.-Mexico maritime boundary (Fig. 1 & Figure S1). Except for three individuals (Fish 2, 27, and 31), all tagged cobia reported pop-up and maximum likelihood locations in continental shelf waters (< 200 m depth) between El Mezquital, Tamaulipas, Mexico, and Galveston, Texas, USA.
Table 2
Dispersal of cobia classified as survivors (> 10 days at liberty) in the northwestern Gulf of Mexico.
Fish ID | Tagging Date | Pop-up Date | DAL | Net Displacement (km) | Geodesic Bearing (°) | Azimuthal Direction |
|---|
1 | 17 Jun 2020 | 10 Aug 2020 | 54 | 15.20 | 54.98 | NE |
2 | 04 Aug 2020 | 12 Oct 2020 | 69 | 34.30 | 29.82 | NE |
3 | 06 Aug 2020 | 15 Sep 2020 | 40 | 34.68 | 225.51 | SW |
6 | 25 Sep 2020 | 15 Oct 2020 | 20 | 157.42 | 180.09 | S |
8 | 01 Oct 2020 | 27 Nov 2020 | 57 | 18.92 | 67.84 | NE |
9 | 01 Oct 2020 | 18 Dec 2020 | 78 | 132.47 | 170.43 | S |
10 | 01 Oct 2020 | 04 Dec 2020 | 64 | 48.78 | 95.82 | E |
11 | 13 Oct 2020 | 11 Apr 2021 | 180 | 8.61 | 229.86 | SW |
13 | 13 Oct 2020 | 20 Nov 2020 | 38 | 84.19 | 196.54 | SW |
14 | 14 Oct 2020 | 13 Dec 2020 | 60 | 130.85 | 188.58 | S |
16 | 14 Oct 2020 | 12 Feb 2021 | 121 | 201.86 | 172.29 | S |
23 | 21 Oct 2021 | 01 Feb 2022 | 103 | 133.01 | 164.71 | S |
24 | 21 Oct 2021 | 01 Feb 2022 | 103 | 163.36 | 168 | S |
26 | 06 Aug 2024 | 05 Oct 2024 | 60 | 54.39 | 61.98 | NE |
27 | 06 Aug 2024 | 19 Sep 2024 | 44 | 191.62 | 202.93 | SW |
28 | 16 Sep 2024 | 15 Nov 2024 | 60 | 34.72 | 205.27 | SW |
29 | 01 Oct 2024 | 23 Nov 2024 | 53 | 268.09 | 193.01 | SW |
30 | 01 Oct 2024 | 30 Nov 2024 | 60 | 56.16 | 80.26 | E |
31 | 01 Oct 2024 | 26 Oct 2024 | 26 | 719.64 | 185.72 | S |
32 | 01 Oct 2024 | 30 Nov 2024 | 60 | 166.81 | 188.96 | S |
34 | 01 Oct 2024 | 30 Nov 2024 | 60 | 35.75 | 97.21 | E |
Dispersal is calculated as the net displacement (minimum haversine distance), geodesic bearing, and azimuthal direction between tagging and pop-up locations. DAL, days at liberty.
Unlike dispersal estimates based solely on tagging and pop-up locations, geolocated maximum likelihood tracks revealed more complex movement patterns, with total distances traveled ranging from 697.5–5256.7 km (mean = 2284.0 ± 1860.2 km; Fig. 2). The shortest net dispersal distance (8.6 km) was recorded for Fish 11, which also had the longest maximum likelihood track (5256.7 km). Tagged on 13 October 2020, this individual traveled 300.2 km northeast to offshore Galveston, Texas by 7 December 2020, then moved 141.3 km south toward Port Mansfield, Texas, by 18 January 2021, before returning 8.6 km southwest of its original tagging site by 11 April 2021, completing a 180-d scheduled deployment. Fish 2, tagged on 4 August 2020, displayed an extensive 1781.9-km track, initially moving south 217.4 km into Mexican waters by 1 September 2020, before returning north to shelf slope and off-shelf waters, ultimately reporting a pop-up location 34.4 km northeast of its tagging site on 12 October 2020. Fish 7, tagged off Port Aransas, Texas, on 10 October 2020, traveled 256.6 km north to offshore Galveston by 18 November 2020, overwintering primarily over the mid-shelf between Port Aransas and Galveston.
The remaining three maximum likelihood tracks were shorter deployments (26–44 d), covering distances between 697.5 and 1230.6 km. Fish 13, tagged on 13 October 2020, moved to the shelf edge by 22 October 2020 before returning to nearshore waters on 28 October 2020, eventually heading south with a pop-up location 84.2 km from its tagging site by 20 November 2020. Fish 25, tagged on 21 October 2021, initially moved 99.2 km east-southeast to the shelf edge by 24 October 2021 before returning to nearshore waters by 29 October 2021. It then traveled 161.4 km north of its tagging site, ultimately in mid-shelf waters on 15 November 2021. Finally, Fish 27 tagged on 6 August 2024 moved 115.7 km south-southeast to off-shelf waters by 10 August 2024, returned to mid-shelf waters, then exhibited a second off-shelf excursion on 31 August 2024 leaving from mid-shelf waters off Mexico before returning to U.S. mid-shelf waters by 12 September 2024.
Core Use Areas
Overlapping core use areas (50% RD) identified a high-use region along the central and South Texas Shelf, frequented by multiple individuals (n = 1–4) throughout all observed months (Fig. 3). This high-use region extended southward toward Mexico from August to September, overlapping shelf slope and off-shelf waters, before shifting north toward Galveston from October to December, then returning southward from January to February, representing overwintering habitat. The high-use region followed a north-south orientation mirroring the Texas Coastal Bend and the 200 m isobath along the shelf edge. The number of days and individuals observed each month reflects tag deployment durations, with most cobia tagged in the fall and individuals tracked for < 10 days within a given month excluded.
Several cobia demonstrated interannual site fidelity to the tagging region and specific structures. For example, Fish 11, tagged in October 2020, had a pop-up location just 8.6 km southwest of its original tagging location in April 2021. Additional examples of site fidelity were obtained from recaptured individuals. One cobia tagged on 21 October 2021 was recaptured on 8 October 2022 at the same standing oil and gas platform where it was initially tagged off Packery Channel. Another cobia, tagged on 17 June 2020 at the artificial reef structure M/V Kinta S, a 47.2-m steel cargo ship submerged at the Corpus Christi Nearshore Reef located off Packery Channel and Port Aransas, was recaptured at the same structure nearly one year later, on 14 June 2021.
Vertical and Thermal Habitat Utilization
Vertical and thermal habitat use was analyzed for 24 reporting PAT tags with deployments > 10 d. The mean deployment length for these tags, including four recovered archival records, was 73 ± 43 d (1747 total days). Incorporating 24-h archival data (mean deployment = 83 ± 66 d; 331 total days) with aggregated 24-h transmitted datasets resulted in 380 d of TAD and TAT histograms from 6 tags, 848 d of minimum and maximum depth data from 15 tags, and 1322 d of minimum and maximum temperature data from 24 tags. Differences in the number of tags and days across datasets were due to variations in PAT tag models and the success of transmission to the Argos satellite system following tag release.
Cobia occupied depths from the surface to a maximum of 121 m (Fig. 4). The median daily maximum depth remained relatively stable across most months, ranging between 27 m (IQR 25–28.3 m) and 34 m (IQR 30–37 m), with exceptions recorded in February (42 m; IQR 37–48 m) and April (17 m; IQR 16–26 m), both based on a single tagged cobia (Fish 11). The maximum and minimum recorded temperatures occupied by cobia were 34.5°C and 13.3°C, respectively (Fig. 4). The median daily maximum and minimum temperatures declined from June to October, ranging from 27.5°C (IQR 26.9–28.8°C) to 30.6°C (IQR 29.5–31.6°C) and 24.2°C (IQR 24.1–24.4°C) to 28.8°C (IQR 28.4–29.4°C), respectively. During the overwintering period from November to February, temperatures further declined, ranging from 18.1°C (IQR 17.8–18.5°C) to 24.8°C (IQR 23.5–26.1°C) for median daily maximum temperatures and from 16.9°C (IQR 15.4–17.1°C) to 23.5°C (IQR 22.1–25.2°C) for minimum temperatures.
Cobia exhibited a strong seasonal preference for surface waters, spending 36.4% and 45.2% of their time within the top 3 m of the water column during August and September, respectively, when temperatures were highest (87.0%–99.2% of time spent in 28–33°C waters; Fig. 5). As temperatures cooled, cobia progressively reduced their time near the surface, from 13.5% in November (84.3% at 22–24°C), decreasing further to 5.7%–8.1% from December (75.3% at 19–21°C) through March (54.3% at 16–18°C; Fig. 5).
Diel Behavior
Diel patterns in depth use became more apparent from September through March (Fig. 6). In September, cobia exhibited reverse diel vertical behavior, spending more time in surface waters (0–5 m) during the day and descending to depths of 5–15 m at night while remaining in consistently warm waters (≥29°C). From October through March, cobia transitioned to normal diel vertical behavior, with increased daytime depth use relative to nighttime. This diel pattern became more pronounced from December through March, with Fish 11 primarily occupying depths of 25–35 m during the day, extending to 45 m in February. At night, Fish 11 either moved into shallower waters or exhibited increased vertical activity across depths ranging from 5–30 m, again reaching 45 m in February. While this bimodal depth distribution was evident, thermal habitat use remained less distinct, as cobia generally occupied similar temperatures throughout the diel cycle (Figure S2). However, a gradual decline in temperature use was observed, from ~ 23°C in November to ~ 17°C February.
Transmitted time-series data from the two longest MiniPAT deployments (Fish 7 and 11), spanning October to March, were highly sparse, containing only 0 and 1 complete 24-h day(s) of data within their respective 180-d deployment periods. Therefore, diel depth patterns were analyzed using the recovered archival time series from Fish 11 in relation to seasonal water column thermal structure (Fig. 7). Normal diel vertical behavior was evident from October through March, but distinct seasonal behavioral differences emerged. In October, oscillatory swimming behavior was observed throughout both day and night in warm (≥23°C) nearshore to mid-shelf waters, with Fish 11 frequently moving between the seafloor and surface at night while remaining at deeper depths during the day (Fig. 7). Deeper habitat use increased as temperatures declined from November to March. By mid-February to early March, the water column had become largely well-mixed and cold, with the formation of inversion layers—where warmer temperatures occurred at depth compared to near the surface [33]—in mid-shelf waters offshore of Port Aransas. During this period, Fish 11 exhibited submergence behavior, occupying the relatively warmer waters at depth (Fig. 7). By March, Fish 11 exhibited more pronounced ‘U-shaped’ dive profiles in cooler (16–20°C) nearshore to mid-shelf waters, shifting between shallow waters (0–10 m) at night and deeper focal depths (20–40 m) during the day (Fig. 7).