Mice
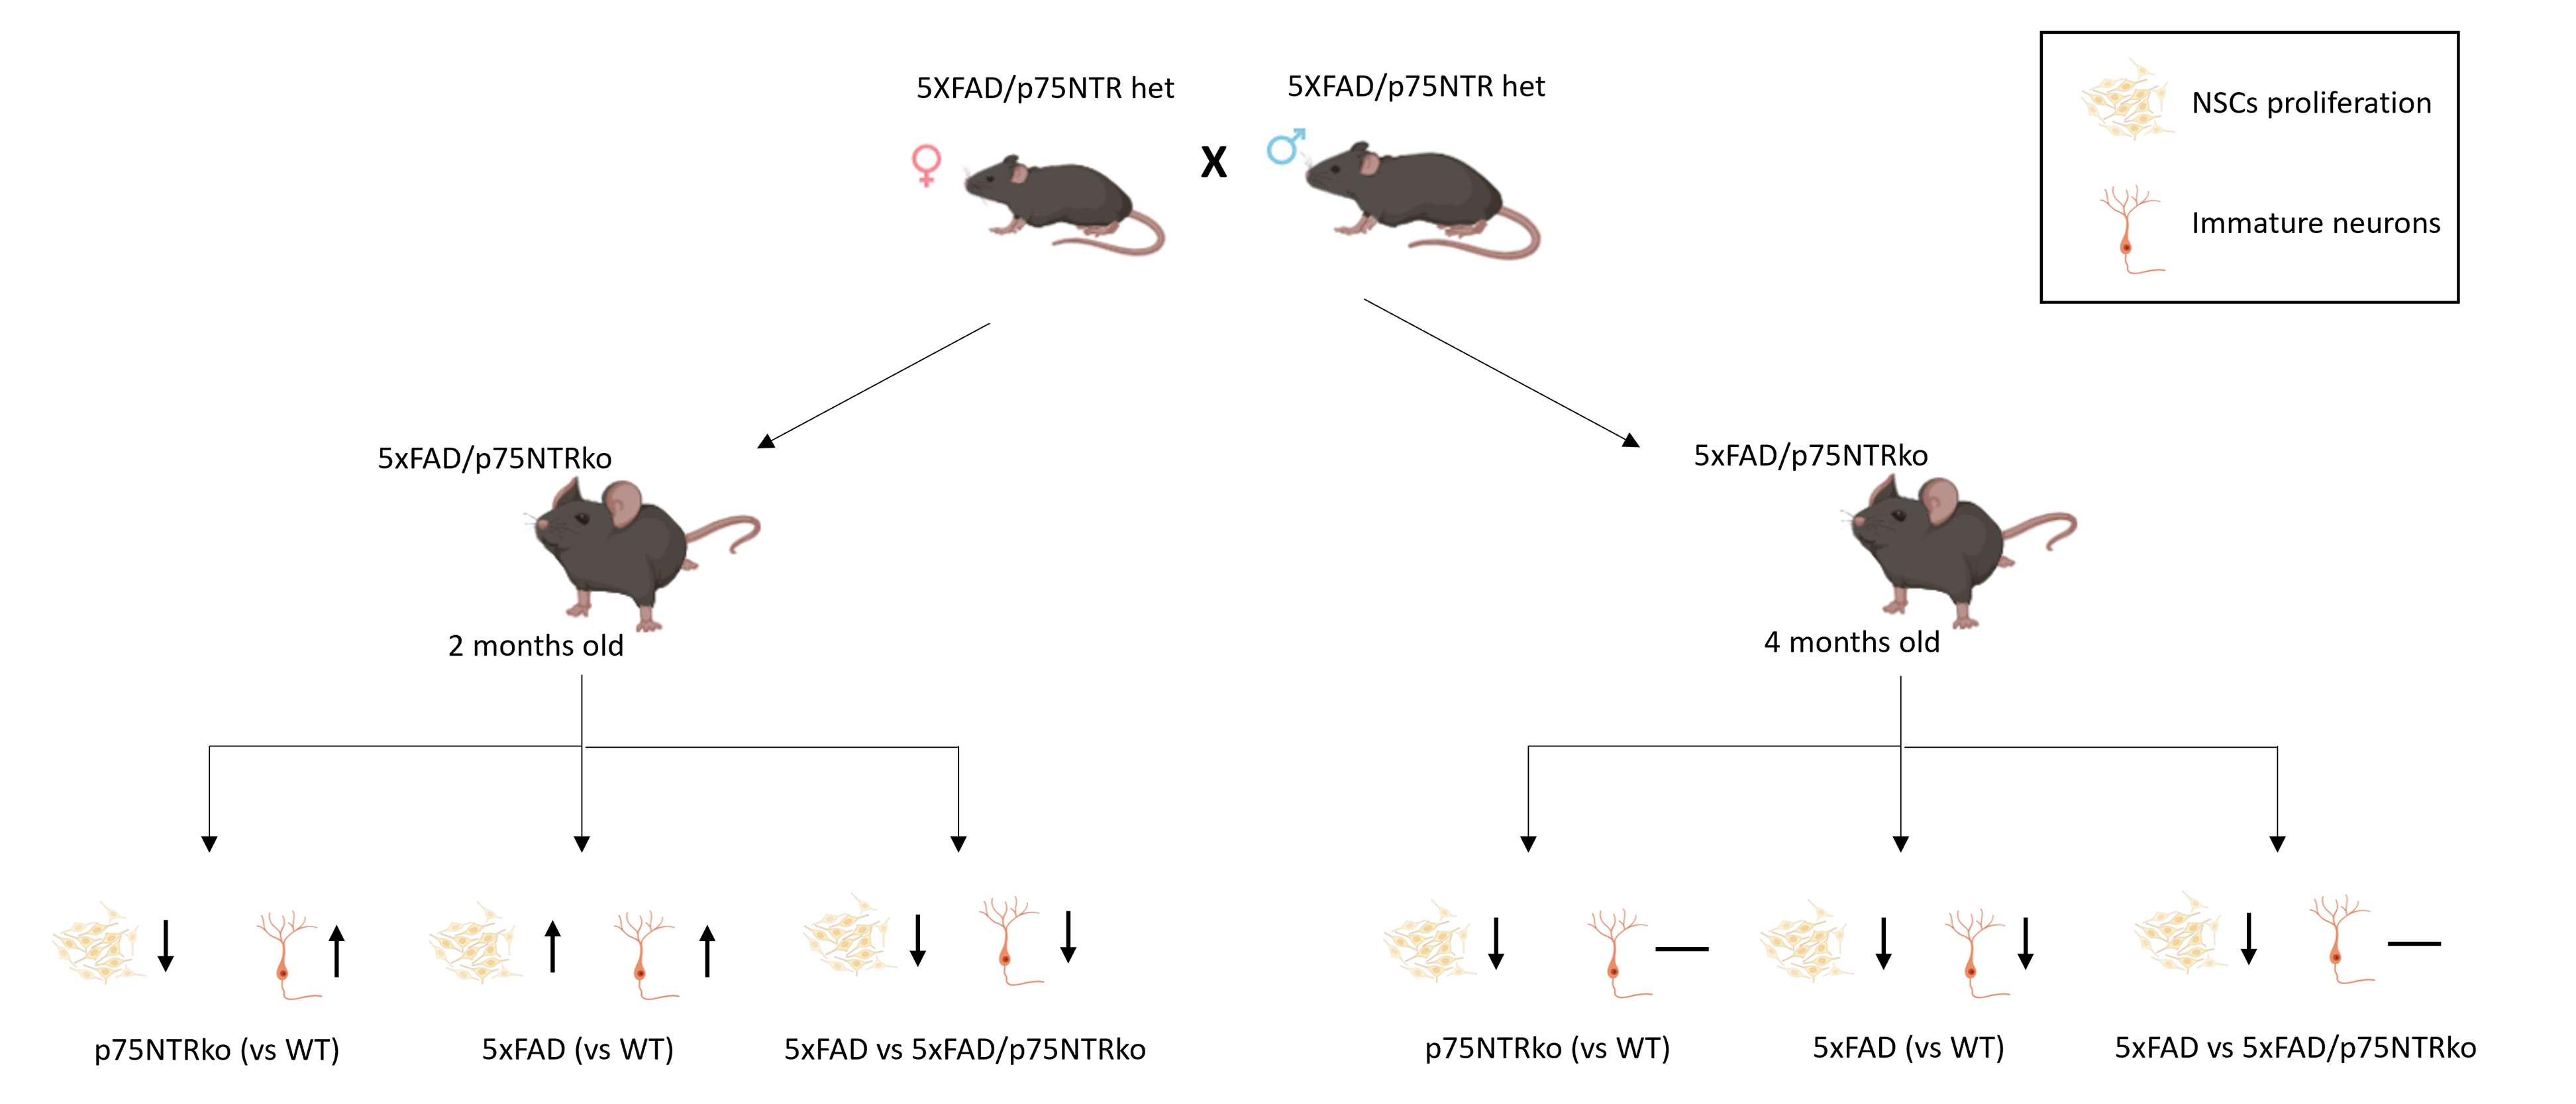
Wild-type (WT), p75NTR ko, p75 fl/fl NestinCre, 5xFAD and 5xFAD/p75NTR ko male and female mice of different ages (2, 4 and 6-months old) were used. p75NTR ko mice (Ngfrtm1Jae ExonIII) and 5xFAD heterozygous mice (#002213 and #034848-JAX, respectively) were maintained on a C57BL/6 background. The p75fl/fl mice (ExonII floxed, Ngfrtm1a(EUCOMM)Wtsi) were crossed with Nestin-Cre transgenics. 5xFAD mice express human APP (Swedish K670N/M671L, Florida I716V, London V717I) and PSEN1 (M146L, L286V) mutations (35), and 5xFAD/p75NTR ko mice were generated by crossing 5xFAD and p75NTR heterozygotes. All animals were housed at IMBB-FORTH, Crete, under standard conditions and in compliance with Greek Government and FORTH ethics guidelines.
BrdU labelling
BrdU i.p. injections 100mg/kg (10mgr/ml-Sigma, St. Louis, MO, USA, B5002) were performed for 5 days (1 injection per day). Analysis was performed either immediately after the BrdU injections (assessment of proliferation) or after 21 days (assessment of survival).
Tissue processing
Mice were anesthetized, trans-cardially perfused with saline and the brains have been dissected. The right hemispheres were further dissected and hippocampal specimens were stored in − 80⁰C for RNA isolation. The left hemispheres were post-fixed by 4% paraformaldehyde (158127, Sigma) overnight at 4⁰C. They were stored in cryoprotective medium (15% sucrose/7,5% gelatine) at − 80⁰C, until they processed for coronal sections. Coronal sections of 40µM were cut in the dorsoventral axis of hippocampus (from bregma − 4mm to -1mm).
Immunohistochemistry
Cryosections were permeabilized by immersion in ice-cold acetone at 20°C for 5 min and washed with 0.1% Triton X-100 in 1xPBS for 15 min and 0.3% Triton X-100 in 1xPBS for 30 min, then blocked for 1hr in 10% donkey serum (S30, Millipore, Burlington, MA, USA) containing 0.1% Triton X-100 in 1xPBS and 0.1% BSA, and incubated overnight at 4⁰C with the above primary antibodies (Table 1). Slides were then washed and incubated with the appropriate fluorochrome-labeled secondary antibodies at room temperature (Table 1). Cell nuclei were visualized with Hoechst (1:10.000, H3570, Invitrogen, Carlsbad, CA, USA). Slides were covered with VECTASHIELD® Antifade mounting medium (VECTOR, Newark, CA, USA) and images were photographed via confocal microscopy (SP8 Leica, Wetzlar, Germany). For double labelling and the detection of BrdU-labeled nuclei, specimens have been previously incubated in 2N HCl at 37⁰C, followed by two rinses with PBS before blocking step.
Table 1
List of primary and secondary antibodies used in Immunohistochemistry-Immunofluorescence and Western blot assay.
|
Antibody
|
Supplier
|
Catalogue Number
|
Dilution
|
Use
|
|
Anti-BrdU
|
Abcam
|
Ab1893
|
1:100
|
IHC, IF
|
|
Anti-Sox2
|
Cell signaling
|
2748
|
1:100
|
IHC
|
|
Anti-DCX
|
Abcam
|
207175
|
1:100
|
IHC
|
|
Anti-NeuN
|
Millipore
|
MAB377
|
1:100
|
IHC
|
|
Anti-cleaved caspase3
|
Cell signaling
|
9661
|
1:300
|
IHC
|
|
Anti-p75NTR
|
Biolegend
|
839701
|
1:1000
|
WB
|
|
Anti-p75NTR (MC192)
|
Abcam
|
ab6172
|
1:100
|
IP
|
|
Anti-RIP2
|
Enzo Life Sciences
|
ADI- AAP-460
|
1:1000
|
WB
|
|
Anti-TRAF6
|
Abcam
|
ab33915
|
1:2000
|
WB
|
|
Anti-actin
|
Santa Cruz Biotechnology
|
sc-47778
|
1:2000,
|
WB
|
|
Anti-mouse Alexa Fluor 488
|
Invitrogen
|
A11029
|
1:500
|
IHC, IF
|
|
Anti-rabbit Alexa Fluor 555
|
Invitrogen
|
A10040
|
1:500
|
IHC, IF
|
|
Anti-sheep Alexa Fluor 647
|
Jackson ImmunoResearch
|
713-605-003
|
1:500
|
IHC, IF
|
|
HRP Anti-mouse IgG
|
Millipore
|
AP- 124P
|
1:5000
|
WB
|
|
HRP Anti-rabbit IgG
|
Invitrogen
|
65-6120
|
1:5000
|
WB
|
Cell counts and quantification
Cell counts and quantification are based on a modified unbiased stereology protocol. Seven out of every 10 adjacent sections were chosen (covering the whole DG area of the hippocampus) and processed for immunohistochemistry. The number of BrdU+, Sox2+, Dcx+, NeuN+ and caspase+ cells was then counted under ×40 magnification under a fluorescent microscope (Leica sp8) at the area of hippocampal DG of a total of 7 sections and the average number of cells was estimated. The mean was then multiplied with the total number of sections (75 per mouse) to estimate the total number of cells per DG.
Generation and Culture of Human Neural Stem Cells (hNSCs)
iPSCs were reprogrammed from skin fibroblasts of two healthy human lines (SFC856-03-04, SFC841-03-01) that were kindly provided by Dr Μ. Z. Cader and used for the generation of neural progenitor cells, as previously described in (38). Briefly, iPSCs colonies were cultured on mouse embryonic fibroblasts (MEFs), in a medium that consisted of DMEM-F12 (21331-020, Gibco, Carlsbad, CA, USA), 20% (v/v) Knockout Serum Replacement (10828028, Gibco), 1% non-essential amino acids (NEAA; 11-140-050, Gibco), 1% penicillin/streptomycin (PAA; 15140122, Gibco), L- Glutamine (A2916801, Gibco), 2-Mercaptoethanol (31350010, Gibco) supplemented with 5 ng/ml FGF2 (100-18C, Peprotech, Cranbury, NJ, USA). Next, iPSC colonies were detached from MEFs with 2 mg/mL collagenase IV (C1764, Sigma) and resuspended in the same medium without FGF2, supplemented with 1 µM Dorsomorphin (ab120843, Abcam, Cambridge, UK), 3 µM CHIR99021 (SML1046, Sigma), 10 µM SB-431542 (72232, Stem Cell Technologies, Vancouver, BC, Canada) and 0.5 µM Purmorphamine (72202, Stem Cell Technologies). Embryoid bodies (EBs) were formed and medium was changed to N2B27 medium (1:1 Neurobasal (21103-049, Gibco) and DMEM-F12 medium, supplemented with N2 supplement (17502048, Gibco) and B27 supplement lacking vitamin A (12587010, Gibco), and 1% penicillin/streptomycin supplemented with the aforementioned small-molecules. On day 4, dorsomorphin and SB-431542 were removed, whereas 150µM L-Ascorbic acid (A4544, Sigma) was added to the medium. On day 6, the spheres were cut into smaller pieces and plated on Matrigel-coated plates (354263, Corning, NY, USA). When confluent, cells were split via treatment with accutase (A6964, Sigma). The identity of the cells was verified via immunocytochemistry for NESTIN (151 NB100-1604, BioTechne, Minneapolis, MN, USA). The generated NSCs can be expanded and cryopreserved enabling long-term, repetitive studies.
Immunoprecipitation and Immunoblotting
Cells were suspended in Pierce™ IP Lysis Buffer (87788, Thermo Fischer Scientific, Waltham, MA, USA) supplemented with protease inhibitors (539138, Calbiochem, Burlington, MA, USA) and phosphatase inhibitors (524629, Calbiochem). Lysates were pre-cleared for 1h with protein G-plus Agarose beads (sc-2002, Santa Cruz Biotechnology, Dallas, TX, USA) and immunoprecipitated with p75NTR antibody overnight at 4⁰C. Protein G-plus agarose beads were incubated with the lysates for 4h at 4⁰C via gentle shaking. Beads were collected via centrifugation, re-suspended in 2× SDS loading buffer and subjected to Western blot analysis against TRAF6 antibody. For immunoblot (IB) analysis, the beads were suspended in sodium dodecyl sulfate-loading buffer and separated through SDS-PAGE. Proteins were transferred to nitrocellulose membranes and blotted with the corresponding antibodies for RIP2, p75NTR, TRAF6 and Actin (Table 1). Immunoblots were developed using the ECL Western Blotting Kit (ThermoFisher Scientific), and Image analysis and quantification of band intensities were performed with ImageJ Software. For the immunoprecipitation assay, the analysis was derived from the immunoprecipitated fraction relative to the total fraction.
Preparation of Aβ Oligomers
Amyloid-β (1–42) peptide was purchased from AnaSpec (AS-20276, AnaSpec, Fremont, CA, USA) and prepared according to manufacturer’s instructions. For Aβ treatment, Aβ oligomers were prepared according to previously described protocols (39, 40), and they were diluted in DMEM at the specified concentrations. Human NSCs were treated with 10µΜ for 48 hours.
Cell Tox Assay
After 24h of treatments, we used the CellTox™ Green Cytotoxicity Assay kit (G8742, Promega Corporation, Madison, WI, USA) to assess the survival of hNSCs in the presence or absence of p75NTR inhibitor MC-192 (2.5 ng/mL, ab6172, Abcam). AD pathology was mimicked by treating the human NSCs with Aβ-amyloid peptides (10µΜ of Aβ1–42 oligomers) and after 24hours we used cell tox assay for another 24h. Dead cells were then counted with a fluorescent microscope at 485–500nm Ex. CellTox assay reagents and Hoescht (1:10,000, H3570, Invitrogen) were added to each well for 30 min, and cells were imaged using a fluorescent microscope (Zeiss AXIO Vert A1, Zeiss, Oberkochen, Germany). Positive cells for cell tox reagent were normalized to reflect the total number of cells per image.
5-bromo-2′-deoxyuridine (BrdU) assay in hiPSCs-derived NSCs
iPSCs-derived NSCs were cultured on Matrigel for 24h with or without treatment of p75NTR inhibitor (ab6172, abcam MC-192, 2,5ng/ml). After 24h the cells were pulsed with 1µM BrdU for 4 hours and fixed with 4% PFA for subsequent immunostaining for BrdU and Hoechst for nuclear labeling.
Isolation of RNA & Sequencing
Total RNA from biological triplicates (hippocampal specimens of p75NTR ko, 5xFAD, 5xFAD/p75NTR ko and WT mice of 2 months old, that have been dissected after the BrdU injections) was extracted using Trizol reagent (15596018, Thermo Scientific) as per the manufacturer’s protocol. The quantity and quality of RNA samples were analyzed using Agilent RNA 6000 Nano kit with the bioanalyzer from Agilent. RNA samples with RNA integrity number (RIN) > 7, were used for library construction using the 3′ mRNA-Seq Library Prep Kit FWD for Illumina (QuantSeq-LEXOGEN, Vienna, Austria) as per the manufacturer’s instructions. Amplification was controlled for obtaining optimal unbiased libraries across samples by assessing the number of cycles (14) required by qPCR. DNA High Sensitivity Kit for bioanalyzer was used to assess the quantity and quality of libraries, according to the manufacturer’s instructions (Agilent, Santa Clara, CA, USA). Libraries were multiplexed and sequenced on an Illumina Nextseq 2000 at the genomics facility of IMBB FORTH according to the manufacturer’s instructions.
Differential Expression and GO enrichment analysis
The quality of the raw sequences in the output FASTQ files was assessed with the FastQC software [www.bioinformatics.babraham.ac.uk/projects/fastqc/]. Reads were aligned to the mouse (mm10) genome using the Hisat2 aligner (parameters used: hisat2 -p32 -x $REFERENCE_GENOME -q fastq/ $FILE_ID.fastq -S $FILE_ID.sam --score-min L,0,-0.5) (41). The BAM files were sorted by genomic coordinates and indexed using samtools (42). Htseq-count was utilized to summarize reads at the gene level (parameters used: htseq-count -f bam -s yes -i gene_id bam $FILE_ID.bam $REFERENCE_ANNOTATION >$COUNTS_DIR/NGS$FILE_ID) (43). Differential expression analysis (DEA) was conducted using EdgeR (44). Two designs were employed, both accounting for gender differences between the mice (gender included as a covariate). The first design also included disease and genotype as covariates (~ disease + genotype + gender), with healthy WT mice treated as the reference. The second design accounted for mouse line as a group covariate (~ group + gender, groups: WT, 5xFAD, p75NTR ko, 5xFAD/p75NTR ko), with WT mice as the reference. Differentially expressed genes (DEGs) were identified using a significance threshold of adjusted p-value (padj) < 0.05. Enrichment analysis was performed using the Metascape web tool (enrichment p-value set to 0.05) (45). Gene Set Enrichment Analysis (GSEA) tool was also used, to analyze the functional changes in gene expression across genotype (p75NTR ko vs WT) and between 5xFAD and 5xFAD/p75NTR ko samples, as specified by Broad GSEA package using default parameters (46). GO-BP pathways were tested (https://www.gsea-msigdb.org/gsea/msigdb/mouse/genesets.jsp?collection=GO:BP) against a ranked lists of descending LFCs for both contrasts, and we selected some positive hits for display. The volcano and bubble plots were created in R with custom in-house scripts (available upon request).
Reverse Transcriptase PCR & Quantitative PCR
cDNA was synthesized by the total RNA, using the High-Capacity cDNA Reverse Transcription kit (4368814, Thermo Fisher) according to the supplier protocols. Primers for Ngfr, were designed using the NCBI Primer BLAST software (Forward:AGAGAAACTGCACAGCGACA, Reverse:CCATCACCCTTGAGGGCTTG), to detect an area inside the coding sequence of the gene. More specifically, the primer pair was designed as such to amplify specifically the area between exons V and VI (between TMD – Transmembrane Domain and DD – Death Domain). Primers for mouse GAPDH, were also designed to be used as a control sample (Forward: ATTGTCAGCAATGCATCCTG, Reverse: ATGGACTGTGGTCATGAGCC). To run the quantitative RT-PCR, we used 1 µL of cDNA (10 ng/µL) and the KAPA SYBR Fast kit (KK4601, Sigma) according to the supplier’s instructions. The cycling program consisted of 20 s at 95°C, followed by 40 cycles of 95°C for 3 s and 60°C for 30 s on a StepOne Real-Time PCR System (Thermo Fisher Scientific). After the completion of qPCR, a melt curve of the amplified products was performed. The housekeeping gene GAPDH was used to normalize the expression levels between the different conditions. Data were collected and analyzed using the StepOne Software v2.3 (Thermo Fischer Scientific).
Statistical Analysis
All values are expressed as the mean ± SEM. Student’s t-test was used for the comparison of two groups, and one-way or two-way ANOVA were used for multiple group comparisons. A p < 0.05 was considered to mark statistical significance. Statistical analysis was performed using GraphPad Prism 7 (GraphPad Software Inc., San Diego, CA, USA).