Patient population
We systematically assessed the spinal cord vasculature and blood–spinal cord barrier integrity in a cohort of infants diagnosed with severe spinal muscular atrophy, and with survival times ranging from 1 to 12 months.
Patient demographics are detailed in Table 1, and information concerning motor neuron loss and spinal cord development and growth for these cases are previously published [4]. All but one SMA case within this cohort, whose genotype remains unknown, possessed two copies of SMN2. This case has the shortest postnatal survival of just 7 days and is likely to reflect either 1 or 2 copies of SMN2, as 3 copies of the SMN2 gene are associated with significantly longer survival [14, 43, 70].
As is inherent in all autopsy-based comparative pathology studies, differences in the cause of death and preterminal health status must be acknowledged. SMA cases died from SMA-related complications that involved extended periods of metabolic distress and prolonged respiratory decline, while controls died from sudden unexplained death syndrome (n=2), pneumonia (n=2), asphyxia (n=1), or unknown causes in three cases—mostly acute events that likely involve less prolonged systemic compromise than SMA cases. Postmortem intervals ranged from 7–32 hours in SMA cases and 14–69 hours in controls, with unknown intervals for two SMA cases and one control.
Table 1 Patient demographics
Summary of case information including age at death (in days (d) or months (m)), cause of death, SMN2 copy number, post-mortem interval (PMI) where known, and use of samples for light microscopy (LM) and/or transmission electron microscopy (TEM).
|
|
Age of death
(days/months)
|
Cause of death
|
SMN copy number
(SMN1/SMN2)
|
PMI (hours)
|
Application
|
|
Control Cases
|
1d
|
Unknown
|
-
|
25
|
TEM
|
|
4d
|
Unknown
|
-
|
69
|
TEM
|
|
9 d
|
Unknown
|
-
|
Unknown
|
LM
|
|
3.2 m
|
Sudden unexplained infant death
|
-
|
27
|
LM
|
|
5.2 m
|
Viral syndrome/focal acute pneumonia
|
-
|
31
|
LM
|
|
7.1 m
|
Asphyxia
|
-
|
24
|
LM
|
|
9 m
|
Pneumonia
|
-
|
14
|
LM
|
|
12 m
|
Sudden infant death syndrome
|
-
|
27
|
LM
|
|
SMA Cases
|
7 d
|
SMA Type 0
|
Unknown
|
Unknown
|
LM
|
|
1.75 m
|
SMA Type I
|
0/2
|
7
|
LM
TEM
|
|
2.5 m
|
SMA Type I
|
0/2
|
7
|
LM
TEM
|
|
4 m
|
SMA Type I
|
0/2
|
4
|
LM
|
|
7 m
|
SMA Type I
|
0/2
|
25
|
LM
TEM
|
|
11 m
|
SMA Type I
|
0/2
|
32
|
LM
|
|
11m
|
SMA Type I
|
0/2
|
Unknown
|
TEM
|
VWF expression is decreased in endothelial cells in the SMA spinal cord
Spinal cord vasculature was visualized by immunostaining sections for von Willebrand factor (VWF), a widely used cytosolic marker of endothelial cells and endothelial cell health [59].
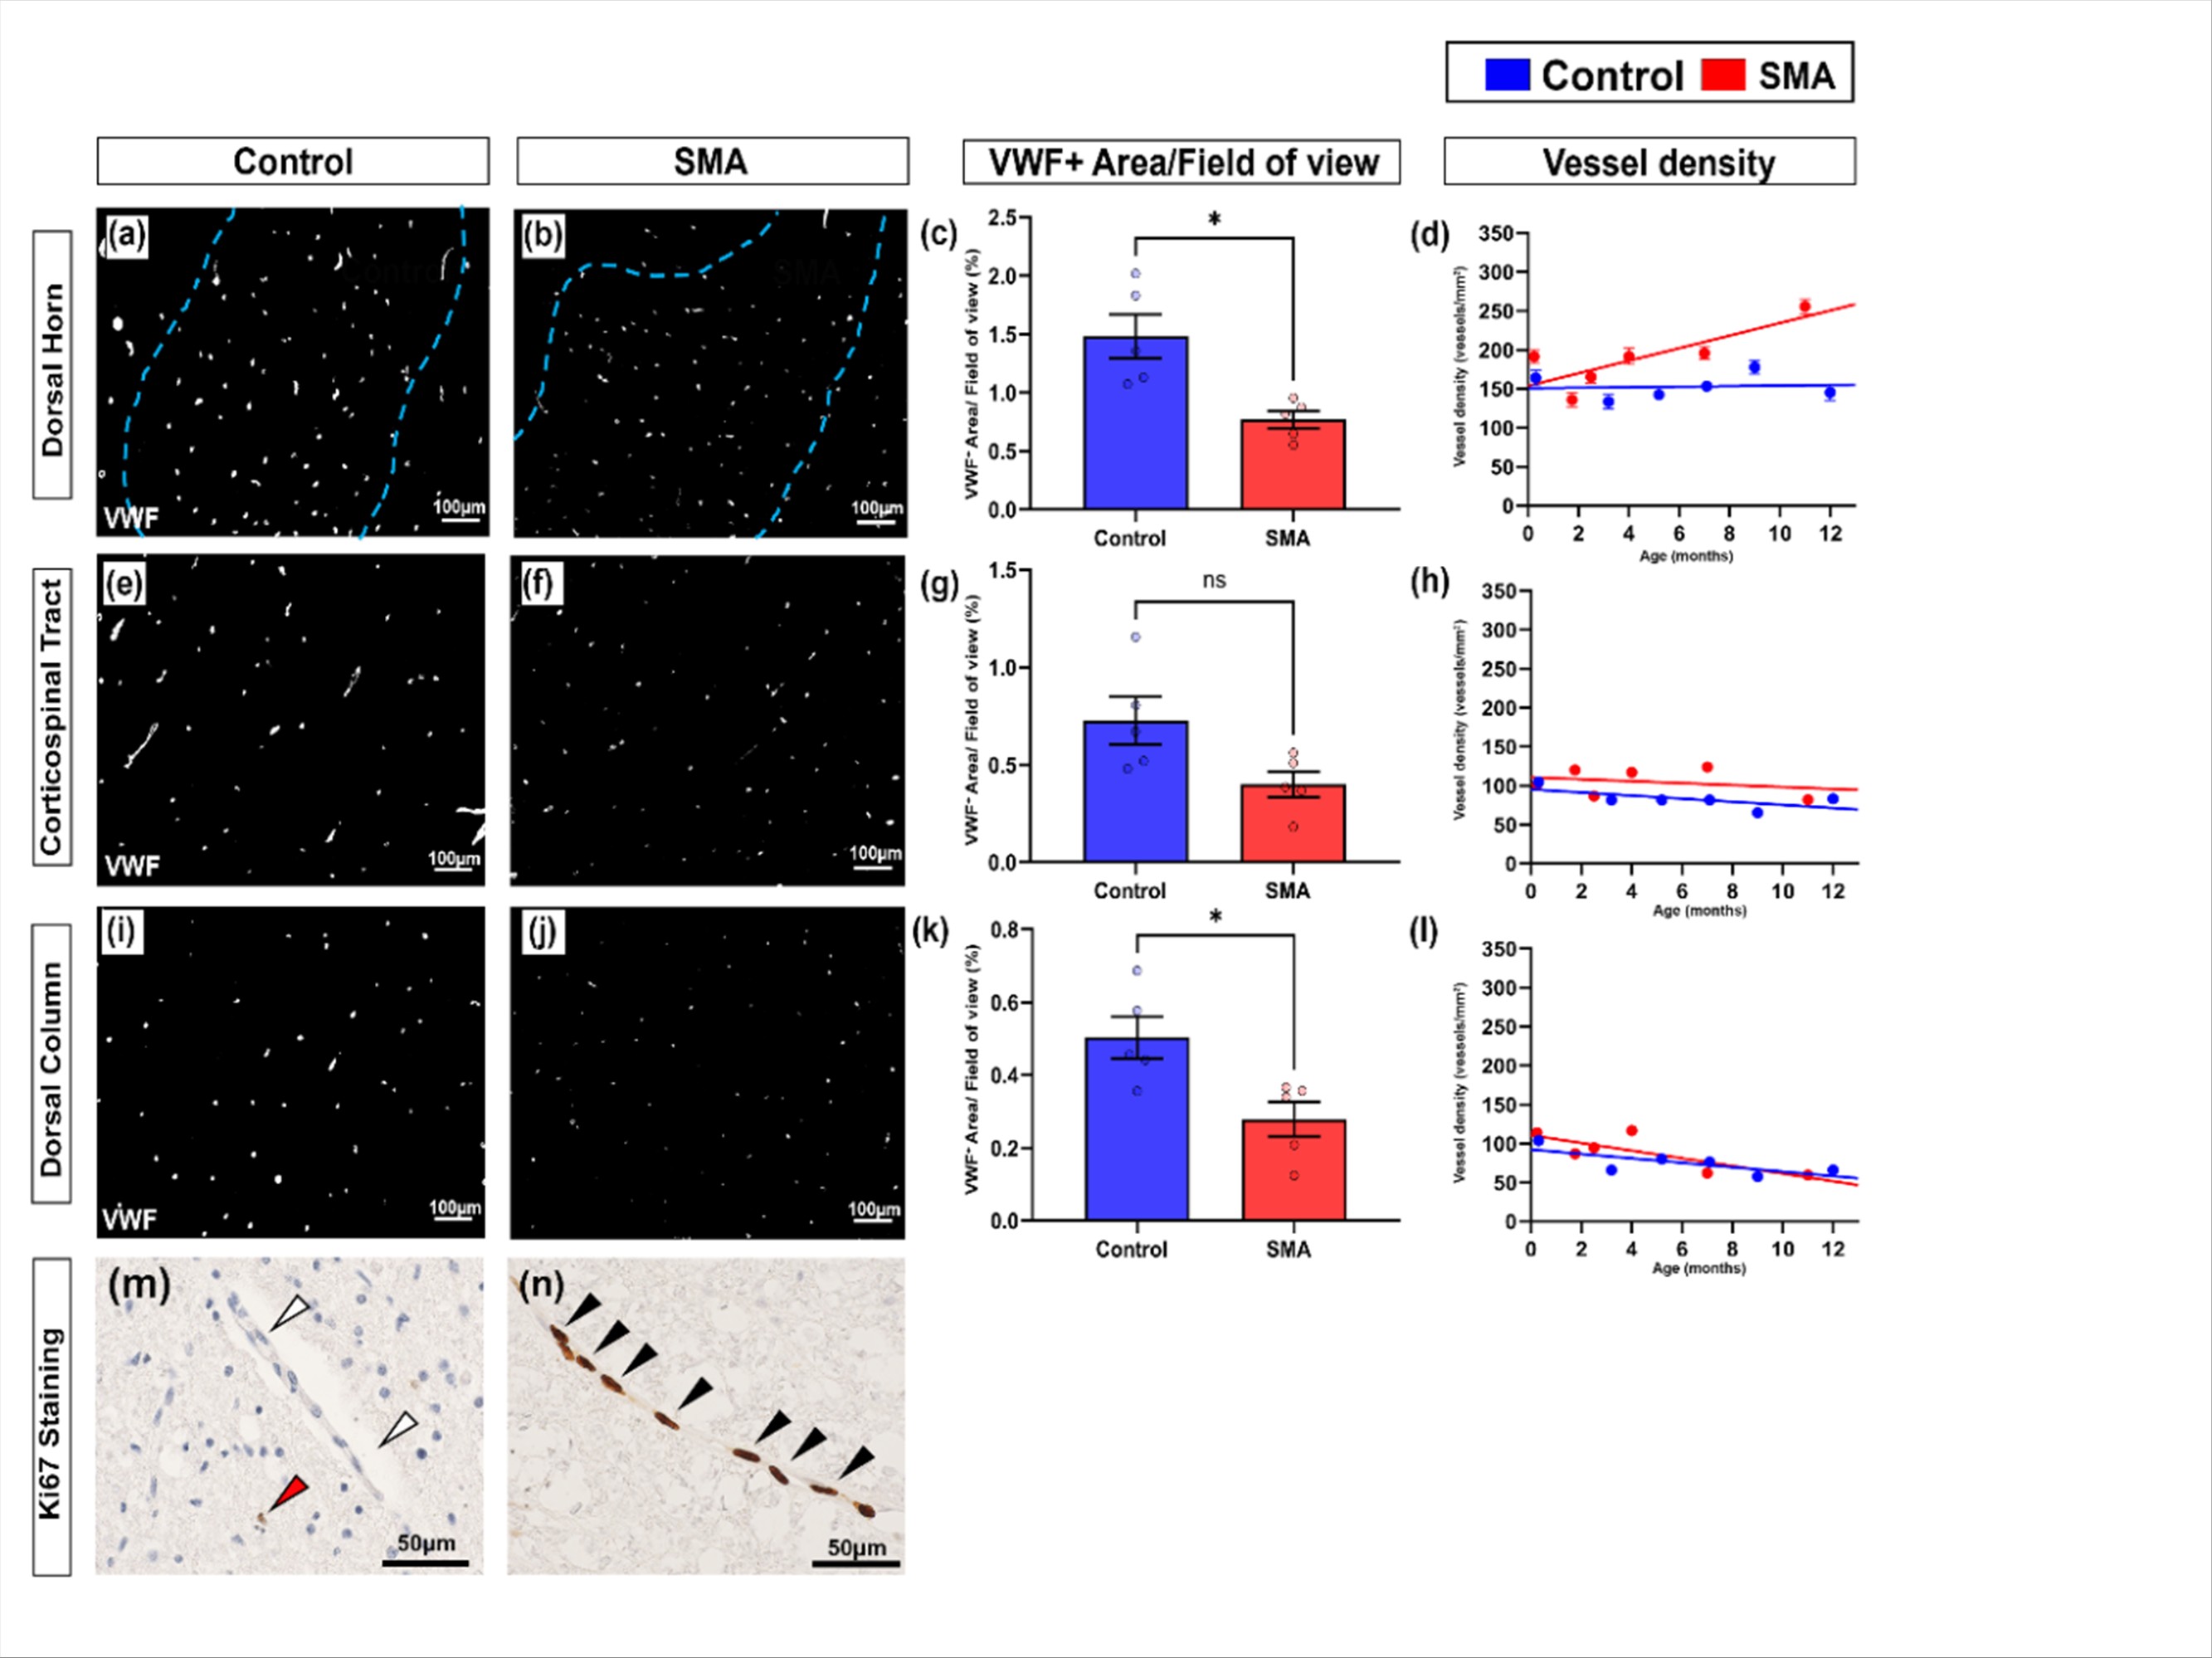
As the primary site of neurodegeneration in SMA, we first analysed the ventral horn. In control cases, VWF staining of individual blood vessels was bright and uniform in contrast to SMA cases, where vessels were more heterogeneously stained (Fig. 1a-b). Total VWF positive stained area (expressed as a percentage of total area stained) was significantly lower in SMA ventral horn compared to age-matched controls: control = 1.99% (+0.17), and SMA = 0.79% (+0.10), mean (+SEM), **P <0.01 (Fig. 1c). We extended analyses to also assess afferent and efferent regions and associated tracts involved in motor control. Stained area was also significantly lower in SMA grey matter dorsal horn (*P <0.05) and white matter dorsal column (*P <0.05) but did not reach statistical significance in the white matter corticospinal tract (Pns, Supplementary Fig. 1c, g, k).
To assess whether the decrease in total VWF levels were the result of decreased vessel density in SMA, we quantified the number VWF positive vessel profiles by applying design-based stereology. Vessel density was not lower in SMA cord in any of the 4 regions of interest, rather increasing with increased survival time in both ventral horn (Fig. 1d) and dorsal horn (Supplementary Fig. 1d). Indeed, Ki67 labelling revealed that endothelial cells, were frequently proliferating in the SMA spinal cord, but not in controls (Supplementary Fig. 1m-n). For SMA cases that received artificial ventilation during clinical care, no correlation was observed with increased vascular vessel density and endothelial proliferation. In summary, the decrease in total VWF could not be attributed to lower vessel density in SMA.
Release of VWF from endothelial cells is a marker of dysfunction, therefore as the overall reduction in VWF expression was not associated with vessel loss, we next assessed if it was associated with reduced VWF expression per vessel. VWF stained area was reduced by an average of 60% in individual vessel profiles in SMA spinal cord compared to age-matched controls, control = 102μm2 (+12) and SMA = 41μm2 (+5), mean (+SEM), **P <0.005 (Fig. 1e). Platelets, which also express VWF, were not observed within vessels, and did not affect our assessments.
Given our observation of reduced VWF in vessel profiles, we next used transmission electron microscopy (TEM) in a subset of age-matched cases (0–1 year) to determine if reduced VWF per vessel profile in SMA spinal cord was due to changes in the size or number of endothelial cells in each vessel profile. However, no differences were observed between SMA and control cases in endothelial cell area (Fig. 1h-j): control = 38.15µm² (+12.56), SMA = 30.61µm² (+3.54), mean (+SEM), nuclear frequency (as a surrogate for endothelial cell number: Fig. 1l): control range = 0.33-0.55, SMA range = 0.23-0.65 (Fig. 2h), or luminal diameter (Fig. 1j-l): control = 5.69µm² (+0.39), SMA = 5.55µm² (+0.43), mean (+SEM).
These findings show that the decrease in total VWF expression is independent of vessel density, cell number or size, rather representing decreased VWF per endothelial cell in the SMA spinal cord.
Endothelial integrity is disrupted in the SMA spinal cord
We extended evaluation of endothelial cell health to the ultrastructural level, examining cross sections of vessels in electron micrographs from four SMA and two control cases (demographics in Table 1). Vessels imaged were likely small arterioles, venules and capillaries, as larger vessels are typically associated with the meninges or are travelling in the plane of the section and rarely observed cross-sectionally [65].
In control spinal cords, vascular endothelial cells displayed classical features: flattened nuclei against the vessel wall, electron-dense cytoplasm, and intact luminal membranes [24] (Fig. 2a). In contrast, SMA vascular endothelial cells exhibited disrupted plasma membranes (Fig. 2b), cytoplasmic oedema, organelle disruption, and vacuolisation (Fig. 2c), all indicative of a loss of cellular integrity and compromised cell health. These abnormalities were specific to endothelium, and surrounding glial cells appeared unaffected.
Endothelial cells form the inner layer of the blood spinal cord barrier (BSCB), establishing a continuous monolayer of cells adjacently connected by tight junctions and anchored to the underlying basement membrane on their basal surface [23]. A healthy endothelial cell from control spinal cord (segmented in yellow) with underlying basement membrane (red dashed line) is shown in Fig. 2d for reference. In SMA, endothelial discontinuities were evident in two of four cases, with gaps in the endothelial lining allowing direct blood cell contact with the basement membrane (Fig. 2e). Basement membrane abnormalities, including detachment from the endothelial layer, 3/4 cases, (Fig. 2f) and focal thickening, 4/4 cases, (Fig. 2g-h) were also observed in SMA but not in controls. Endothelial intracellular oedema and membrane rupture were the most consistent pathological features in SMA cases (Fig. 2i).
Pericyte and Astrocyte End-Feet abnormalities in SMA Spinal Cord
Having identified pathological changes to the endothelial cell layer and basement membrane, we next examined pericytes and astrocyte end-feet, the remaining key cellular components of the BSCB.
In control spinal cord, pericytes displayed classic "bump on the log" morphology, lying adjacent to the endothelium with prominent nuclei, limited cytoplasm and long processes wrapping the vessel wall (Fig. 3a) [7]. In contrast, SMA pericytes showed cytoplasmic swelling, oedema (Fig. 3b), and vacuolisation (Fig. 3c).
Astrocyte end-feet form the outer BSCB layer, and appeared normal in control spinal cord with sparse cytoplasmic filaments [9, 45], (Fig. 3d). This contrasts with the astrocytic end-feet visualized in the SMA cases that displayed abnormal filament accumulation (Fig. 3e) and cytoplasmic vacuolisation (Fig. 3f). Immunofluorescence staining showed a visible increase in glial fibrillary acidic protein (GFAP) expression across all spinal cord regions in SMA cases (Fig. 3g–h).
Evidence of BSCB Compromise in the SMA spinal cord
Given our ultrastructural findings and prior evidence of vascular impairment in both SMA patients and animal models, we next looked for pathological markers of BSCB dysfunction by analysing the distribution of fibrinogen and haemoglobin by immunohistochemistry.
Fibrinogen, a large plasma protein normally restricted to the vascular lumen [51], where it was confined in control spinal cords (Fig. 4a). In contrast, extravascular fibrinogen was detected frequently in SMA spinal cord, presenting as either diffuse staining around the vessel or as focal perivascular deposition (Fig. 4b–c). Extravascular fibrinogen was present in all five SMA cases (median 7. 45%, range 0.95–69.76%) (Fig. 4d), most prominently in the dorsal horn, but not observed in controls (median 0.00%, range 0.00–0.04%).
Haemoglobin, which may be released during or shortly after vascular injury [66], was co-stained with VWF to localise its presence in relation to vessels. In controls, haemoglobin was present intravascularly (Fig. 4e), whereas in SMA spinal cords, extravascular haemoglobin was found surrounding vessels in the neural parenchyma (median 1.17%, range 0.00–18.14%) (Fig. 4f-g). Extravascular haemoglobin was most often seen in the dorsal column.
At the ultrastructural level, extravasated red blood cells were observed in 2 of 4 SMA cases, but not in controls (Fig. 4h), while perivascular oedema was a consistent feature across all SMA spinal cords examined (Fig.4i).
Pronounced Microglial Activation is present throughout the SMA spinal cord
The presence of plasma proteins in the neural parenchyma suggests vulnerability to BSCB disruption in SMA. A downstream consequence is the potential for reactive neuroinflammation associated with glial activation [67]. This was assessed by microglial Iba1 immunofluorescence in all regions of interest. In control spinal cords, microglia exhibited a ramified morphology typical of a resting state (Fig. 5a). In comparison, SMA microglia were clustered, with an ameboid morphology, retracted processes and reduced branching, consistent with an activated and reactive microglial phenotype [47], (Fig 5b). Microglial cell number was broadly similar in SMA and controls (control: 51± 8; SMA: 78 ± 17 Iba1⁺ cells per FOV, Pns <0.05), (Fig. 5c). Microglial activation was increased in SMA cases, where almost all Iba1 positive microglia co-expressed the macrophage activation marker CD68 (97.36% ± 0.29), compared to none in controls (Fig. 5d–f). This reactive microglial phenotype was observed throughout the spinal cord, not only in the ventral horn where motor neuron degeneration occurs, suggesting microglial activation was a widespread characteristic in these cases of SMA.