Estimation of total phenolic, flavonoid and tannin contents
Estimated Total phenolic (TPC), total flavonoid (TFC) and total tannin contents (TAC) of the poly herbal decoction and individual plant decoctions are summarized in Table 2. According to the results, APD and TPD have shown higher TFC and TAC contents. However, in TPC estimation, the highest value (49.01 ± 4.9 mg GAE/g) was observed in PHD while TPD and WSD resulted in considerably lower values (1.9 ± 0.1 mg GAE/g, 0.4 ± 0.0 mg GAE/g respectively). The estimation of TPC considers flavonoids and tannins, which encompasses a broad range of compounds including other phenol-type derivatives, this may be the reason for the deviations in TPC estimation (Muflihah, 2021).
Table 2
Total Phenolic Content, Total Flavonoid Content and Tannin Content of the PHD and individual plant decoctions; APD, TPD, TCD and WSD. The values are mean of three independent experiments ± standard deviation (SD)
Decoctions | TPC (mg GAE/g) | TFC (mg QCE/g) | TAC (mg TAE/g) |
|---|
PHD | 49.1 ± 4.9 | 1.0 ± 0.1 | 24.7 ± 2.2 |
APD | 44.6 ± 2.6 | 1.8 ± 0.4 | 64.9 ± 5.8 |
TPD | 1.9 ± 0.1 | 7.8 ± 0.8 | 74.2 ± 7.6 |
TCD | 5.1 ± 0.2 | 0.1 ± 0.0 | 1.1 ± 0.3 |
WSD | 0.4 ± 0.0 | 0.1 ± 0.0 | 1.1 ± 0.3 |
| Antioxidant assays |
In the present study, three different antioxidant assays are used to accurately confirm the antioxidant ability of each decoction.
DPPH assay
The present findings indicate that all decoctions induced a colorometric transition of DPPH confirming the antioxidant capacity. PHD exhibited antioxidant activity with an EC50 value of 44.2 ± 0.7 µg/mL, while TCD and WSD resulted with EC50 value of 1025.5 ± 11.6 µg/mL 1011.9 ± 15.9 µg/mL respectively. APD displayed significantly stronger antioxidant activity (EC50 value of 15.0 ± 0.5 µg/mL) as given in Table 3.
Hydroxyl radical scavenging assay
All the decoctions produced a characteristics pink chromogen upon thermal treatment, indicating the presences of phenolic compounds. PHD exhibited antioxidant activity with an EC50 of 36.5 ± 0.2 µg/mL and TPD had the most potent antioxidant activity (EC50 value of 13.2 ± 0.2 µg/mL), while WSD resulted in weakest anti-oxidant activity with EC50 858.1 ± 14.3 µg/mL (Table 3).
Table 3
Comparative Antioxidant activities of PHD and individual plant decoctions. The values are mean of three independent experiments ± standard deviation (SD)
Decoction/ Standard | EC50 values (µg/mL) |
|---|
DPPH | Hydroxyl radical scavenging assay |
|---|
PHD | 44.2 ± 0.7 | 36.5 ± 0.2 |
APD | 15.0 ± 0.5 | 13.2 ± 0.2 |
TPD | 15.5 ± 0.2 | 12.4 ± 0.1 |
TCD | 1025.5 ± 11.6 | 816.3 ± 16.6 |
WSD | 1011.9 ± 15.9 | 858.1 ± 14.3 |
Ascorbic Acid | 5.42 ± 0.10 |
Ferric ion reducing power assay
The dose-response curves of ferric ion reducing power assay are presented in Fig. 1. TCD (200–600 µg/mL of concentration range in between 0.300-1.000 of absorbance) and WSD (with 175–600 µg/mL of concentration range in between 0.300–0.600 of absorbance) were excluded in the figure.
Results from all three antioxidant assays, confirmed significant anti-oxidant activities in all tested decoctions with varying potency. APD and TPD demonstrated strongest antioxidant properties whereas TCD and WSD with the weakest antioxidant properties PHD exhibited intermediate anti-oxidant properties due to its composition containing individual components, PHD was prepared as a mixture including all the individual components together where it can be expected to have the highest antioxidant properties as a collective of all the herbal decoctions. However, this effect may be affected by the interactions and reactions of different components which may not undergo when they are in separate individual extracts and also no correlation was observed between antioxidant (DPPH) and TPC, TFC and TAC.
Oxidation assays
Inhibition of Protein oxidation
The maximum inhibitory activity (lowest EC50) was demonstrated in PHD at 223.7 ± 1.8 µg/mL, while TCD exhibited a marginal inhibitory effect at EC50 value of 511.8 ± 4.5 µg/mL (Table 4).
Table 4
Inhibition of protein oxidation and lipid peroxidation shown by PHD and other individual plant decoctions; APD, TPD, TCD and WSD. The values are mean of three independent experiments (n = 3) ± standard deviation (SD)
Decoction | EC50 values (µg/mL) |
|---|
Protein oxidation | Lipid peroxidation |
|---|
PHD | 223.7 ± 1.8 | 383.2 ± 8.7 |
APD | 343.8 ± 0.9 | 206.4 ± 2.7 |
TPD | 260.5 ± 2.2 | 207.6 ± 3.5 |
TCD | 511.8 ± 4.5 | 523.7 ± 6.2 |
WSD | 295.0 ± 10.1 | 156.9 ± 12.4 |
Inhibition of Lipid Peroxidation
Lipid peroxidation was quantified spectrophotometrically by measuring the chromogenic transition in the reaction medium. WSD demonstrated the maximal inhibitory activity(EC50 156.9 ± 12.4 µg/mL), while APD (EC50 206.4 ± 2.7 µg/mL) and TPD (EC50 207.6 ± 3.5 µg/mL ) exhibited the minimal marginal inhibitory activity as given in Table 4. All decoctions exhibited ac considerable anti-oxidant activity against both protein oxidation a lipid oxidation. However, no significant correlation was observed between these protective effects, suggesting distinct mechanisms of action for each oxidative pathway.
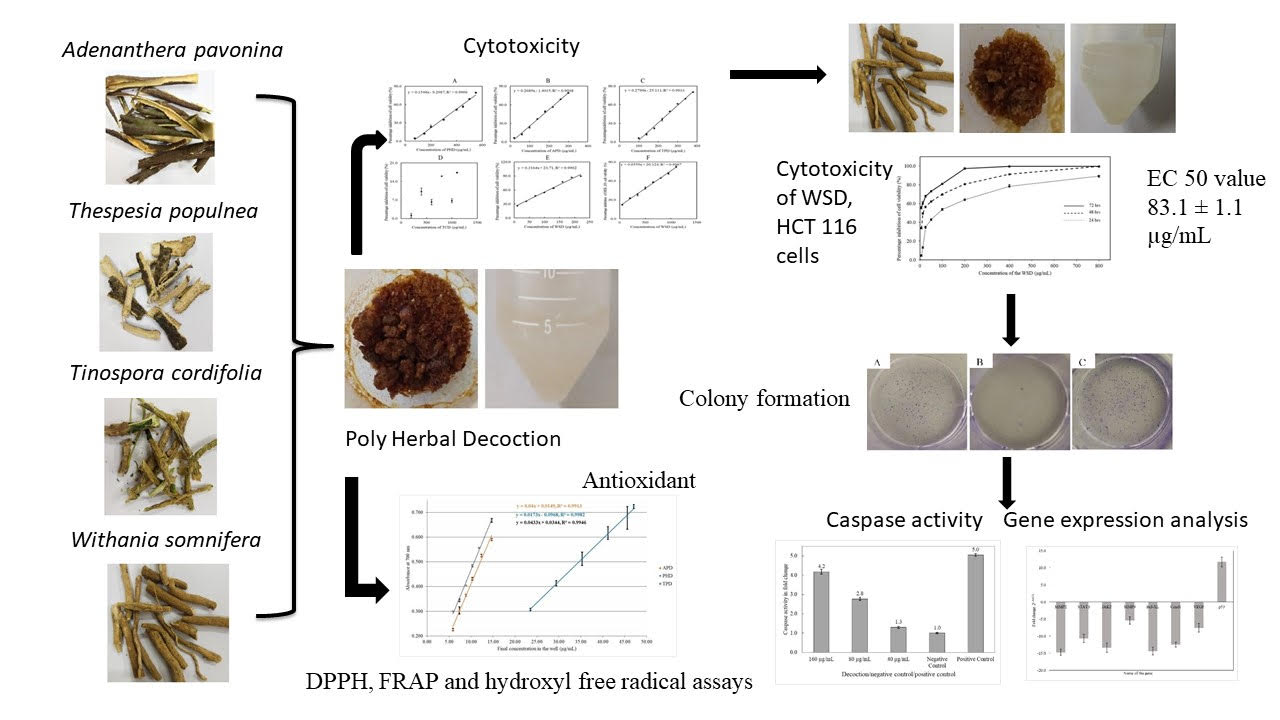
Cytotoxicity assays
MTT assay was employed in determining the cytotoxicity of the decoctions against the colorectal carcinoma. Level of cytotoxicity of the PHD and its individual decoctions against HCT 116 and HEK 293 cells were determined by MTT assay after 24 h of treatments (Table 5). As shown in Table 5, the highest cytotoxic effect was observed with WSD (EC 50 value; 83.1 µg/mL), However, no significant e cytotoxic effect was detected in TCD decoction, while PHD (EC50 383.1 ± 2.7 µg/mL) resulted in a comparatively higher EC50 value than TPD (EC50 268.3 ± 1.3 µg/mL) the least active individual component (Fig. 2). The EC50 values of the individual components resulted in a wide range from 83.1 µg/mL to 268.3 µg/mL.
A positive correlation was observed in PHD, APD, TPD and TCD decoctions, however a significant correlation was not observed in WSD, which demonstrated a strong cytotoxicity comparatively to other decoctions. While WSD exhibited potent anti-cancer activity, due to its low total phenolic, flavonoid and tannin content a significant correlation was not observed. Comparatively WSD exhibited highest anti-cancer activity against HCT 116 cells than individual components decoction and PHD. Based on this activity, WSD was selected for further studies.
Table 5
Level of cytotoxicity of the PHD and its individual decoctions against HCT 116 and HEK 293 cells by MTT assay after 24 h of treatments, expressed as mean ± SD of three individual experiments (n = 3). *n = 2
Decoctions | Cell line | EC50 values (µg/mL) |
|---|
PHD | HCT 116 | 383.1 ± 2.7 |
APD | HCT 116 | 191.2 ± 2.7 |
TPD | HCT 116 | 268.3 ± 1.3 |
TCD | HCT 116 | Not detected |
WSD | HCT 116 | 83.1 ± 1.1 |
WSD | HEK 293 | 534.5 ± 16.0* |
* The value is a mean of two independent experiments (n = 2) ± standard deviation (SD)
In consistent to our study, A prior research reported the dose dependent and time dependent anti-cancer activity in Withania somnifera crude extract against human malignant melanoma cells (Halder, 2015). Evidently a study performed with Withania somnifera fruit extract resulted in cytotoxicity against HCT 116 cells with a LC50 value of 410.2 µg/mL, and HepG2 cells with a LC50 value of 164.7 µg/mL as the highest cytotoxicity demonstrated (Abutaha, 2015).
Table 6
Cytotoxicity effects of the WSD after 24, 48 and 72 h of treatments.
Time | EC50 values (µg/mL) |
|---|
24 h | 81.2 ± 0.7 |
48 h | 17.4 ± 0.1 |
72 h | 3.1 ± 0.3 |
Figure SEQ Figure \* ARABIC 3. At 24 hours, EC50 of WSD was 81.2 ± 0.7 µg/mL. When the incubation period was extended for 24 and 72 hours, the EC50 values decreased to 17.4 ± 0.1 µg/mL and 3.1 ± 0.3 µg/mL against HCT 116 cells respectively.
LDH leakage
Quantification of membrane integrity damage was demonstrated upon WSD treatment within 24 h, a significant LDH leakage (59.5 ± 2.1%) was exhibited resulting in dose dependent cytotoxicity as demonstrated in Fig. 4. LDH leakage and increased level of LDH release were previously reported in Withania somnifera extract-treated on androgen-independent prostate cancer 3 cells (PC3) exhibiting the anti-proliferative effect. (Balakrishnan et al., 2017). Similarly, in another study Withania somnifera root powder was reported to have a significant suppression in lysosomal and cytoplasmic enzyme release in polymorphonuclear leucocytes cells (Rasool, 2006).
Colony forming assay
As of the obtained data, the WSD decoction treatments have significantly reduced cell proliferation and differentiation into colonies (262 ± 20). The negative control resulted in higher number of colonies after 7 days of the treatments (595 ± 22), while the positive control resulted in 2 ± 2 colonies, as shown in Fig. 5.
Sumantran et al 2007 reported that aqueous extract of Withania somnifera roots had a dose dependent inhibition in colony formation with Chinese Hamster ovarian cell line. It also reported that Withania somnifera root extract induce long term growth inhibition of CHO cells which was cell density dependent upon the drug treatment (Sumantran et al 2007).
Ethidium bromide/acridine orange (EB/AO) assay
Acridine orange (AO) is a chromatin staining dye that emits green fluorescence upon intercalation and enters live cells with normal membrane potentials. Hence, it is important in live, healthy and proliferating cells. Ethidium bromide (EB) penetrates only the cells that have lost their membrane integrity and emits a fluorescence of red upon DNA intercalation. Further, it dominates over AO. This makes the live cells in green colour and apoptotic and dead cells in orange-red colour (Ribble et al., 2005).
Nuclei stained with green colour indicate live cells, while greenish yellow shows early apoptotic cells. Condensed orange red nuclei demonstrate late apoptotic cells, whereas red colour indicates dead cells. As shown in Fig. 6, the EB/AO assay resulted in prominent apoptotic morphology in the HCT 116 cells upon treating with WSD for 24 hours. As shown in Fig. 6A, orange colour and red colour cells were observed, indicating the late apoptotic cells and dead cells respectively. When the cells were observed in high power, fragmented nuclei were observed as in 6B. The images 6C and 6D indicate the negative and positive control respectively. The morphological changes of the images indicate the ongoing apoptosis in the cells upon treatment.
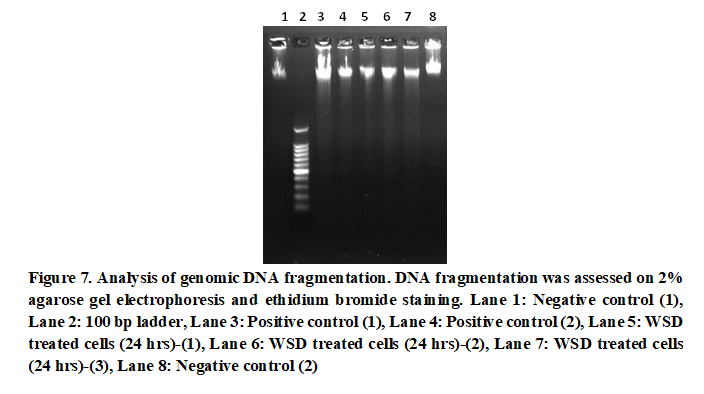
DNA fragmentation
As shown in Fig. 7, HCT 116 cells resulted in DNA fragments upon treatment after 24 hours. According to the gel image visualization, faint bands of DNA fragments provide evidence of active apoptosis. As the negative control is free of such DNA fragments, it can be concluded that the WSD treatment has initiated apoptosis and DFF function, resulting DNA fragments in the HCT 116 cells.
DNA fragmentation is a main feature of apoptosis and thus is considered as a marker of apoptosis. During apoptosis, double-stranded DNA is cleaved at A and T-rich regions by the DNA fragmentation factor (DFF). The 40 kDa catalytic subunit (DFF40) provides the endonuclease activity of the DFF for DNA cleavage, while 45 kDa subunit (DFF45) provides the regulatory functions (Majtnerová & Roušar, 2018). At normal stages, DFF40 remains inactive, which is regulated by DFF45. Upon activation of Casapse3, the DFF40-DFF45 complex is cleaved. Active DFF40 is released, and hence, DNA fragmentation is started. It cleaves DNA in about 180 bp and its multiples (360 bp, 540 bp and 720 bp), resulting a ladder pattern upon agarose gel run (Majtnerová & Roušar, 2018).
Evidently in a previous study Withania somnifera extracts significantly induce in apoptosis against Hepatocellular carcinoma cells (Ahmed et al, 2018). Another study reported that caspase activity was increase on a time dependent manner against HL- 60 cells (Malik, 2009Figure 8. Caspase activity of decoction, negative control and positive control.
Effect of WSD on MMP2, STAT3, JAK2, MMP9 ,Bcl-XL, Ccnd1, VEGF and p53
The effect of MMP2 and MMP9 in apoptosis and cell death
MMP-2 has a role in promoting tumour angiogenesis, which is initially supported by interleukin 8 (IL-8) (Quintero-Fabián et al., 2019). In this study both MMP-2 and MMP-9 were down regulated with negative fold changes of -14.7 ± 0.9 and − 5.4 ± 1.1 respectively. This indicates that the WSD treatment effectively retards the angiogenesis and metastasis in the cancer. It was reported that Withania somnifera has great potential in down regulating MMP-2 and MMP-9, leading to the inhibition of cell migration in neuroblastoma (Kataria et al., 2013).
The effect of Cyclin D1 in cell cycle arrest
Cyclin D1 shows a negative fold change of -12.5 ± 0.7 where the expression is being downregulated. Considerably Withania somnifera has been reported in previous literature as an agent to reduce the Cyclin D1 level in human prostate cancer (Balakrishnan et al., 2017) cells and human neuroblastomas (Kataria et al., 2013).
The effect of VEGF in reducing angiogenesis
Withaferin A, the active component of Withania somnifera has been identified in a previous research study as a compound that reduces the expression of VEGF functioning as an anti-VEGF agent (Saha et al., 2013). In this study, VEGF has exhibited a negative fold change of 7.6, indicating the down-regulation of the expression. This indicates the effectiveness of the WSD in retarding angiogenesis and proliferation of the tumour.
The effect of STAT3 and JAK2 in apoptosis
According to the experimental results given in the Table 7, the expression of both JAK2 and STAT3 were down regulated in 13.4 ± 1.4 and 10.7 ± 1.2 folds respectively which exhibited significantly higher fold changes, collectively this study demonstrated that the WSD decoction promotes apoptosis involving the JAK2/STAT3 gene expression pathway, leading to the death of the tumour cells. The effect of Withania somnifera on STAT3 and JAK2 pathways was described in related to renal carcinoma (Um et al., 2012) and breast cancers (J. Lee et al., 2010) in the literature.
The effect of Bcl-XL in apoptosis
As evident by, the differential expression of Bcl-XL dropped in around 14 folds (-14.4 ± 1.1), indicating the effectiveness of the decoction in promoting apoptosis. The effect of the Withania somnifera on reducing the expression level of Bcl-XL in human Neuroblastomas was reported in a previous study (Kataria et al., 2013).
p53
the analysis demonstratep53 relative expression has increased significantly (11.7 ± 1.3 folds). This can be an overall effect generated from the DNA damage due to the upregulation of p53 and STAT3 down regulation. The upregulation of p53 promoted by Withania somnifera has also been previously reported (Munagala et al., 2011).
Table 7
Names and short names of the genes with their fold change expressed as mean ± S.D of three independent experiments.
Name of the gene | Short name of the gene | Fold change |
|---|
Matrix Metallopeptidase 2 | MMP-2 | -14.7 ± 0.9 |
Signal transducer and activator of transcription 3 | STAT3 | -10.7 ± 1.2 |
Janus kinase 2 | JAK2 | -13.4 ± 1.4 |
Matrix Metallopeptidase 9 | MMP-9 | -5.4 ± 1.1 |
B-cell lymphoma-extra large | Bcl-XL | -14.4 ± 1.1 |
Cyclin D1 | Ccnd1 | -12.5 ± 0.7 |
Vascular endothelial growth factor | VEGF | -7.6 ± 1.3 |
Tumor protein 53 | p53 | 11.7 ± 1.3 |
Glyceraldehyde 3-phosphate dehydrogenase | GAPDH | -1.5 ± 0.1 |