Rhizosphere microbial community assembly
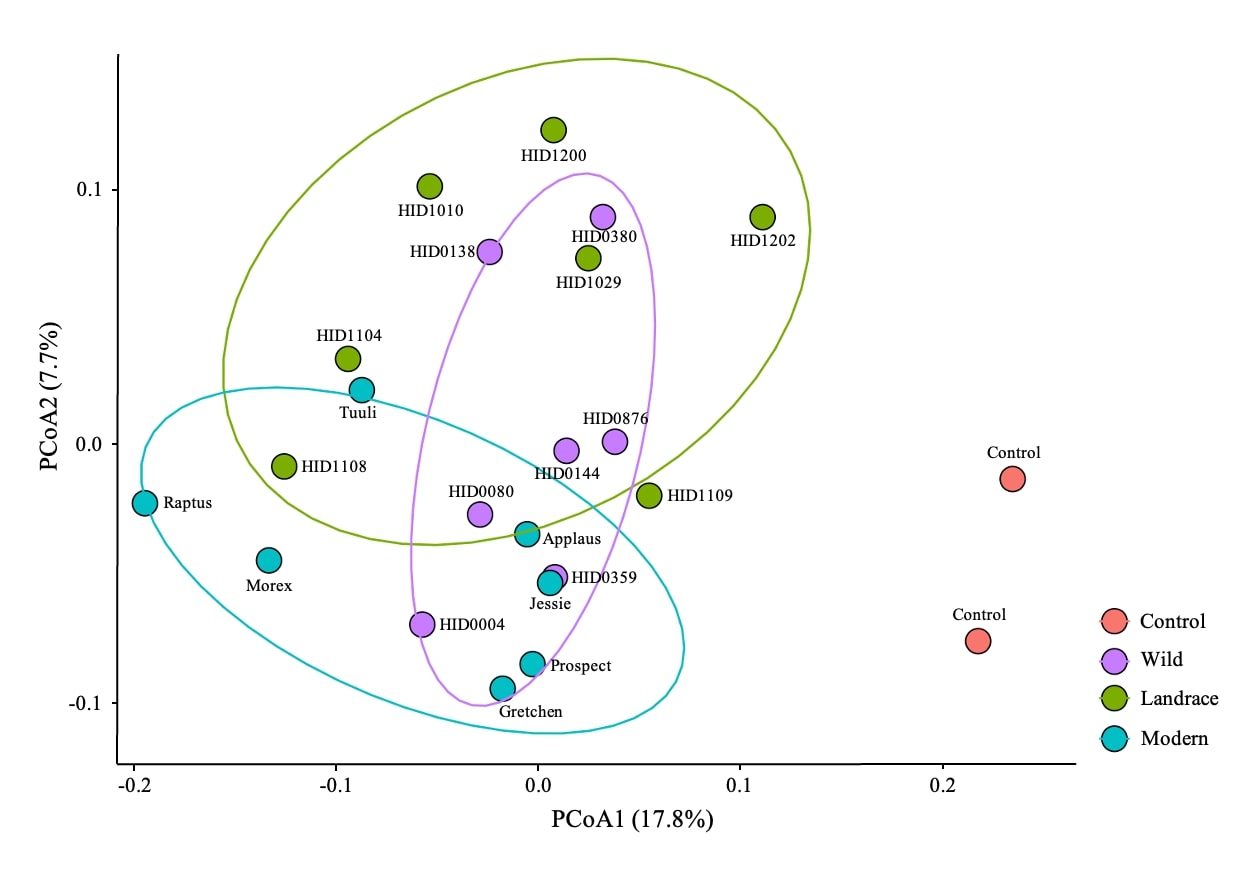
Illumina MiSeq-based short-read profiling of rhizosphere soil microbial communities from 21 barley genotypes (seven genotypes per domestication group) and two controls revealed that barley domestication status significantly influenced microbiome assembly (PERMANOVA: R² = 0.2273, p < 0.001). Pairwise comparisons further showed that all three barley status groups differed significantly from the controls, with the largest dissimilarity observed for wild (31.5%), followed by landrace (25%) and modern (10.8%) barley genotypes. Although modern genotypes differed significantly from both wild and landrace groups, no significant difference was detected between wild and landrace genotypes (Supporting Table S1). Consistent with these results, PCoA ordination demonstrated clear separation among the genotype groups, with the first two axes explaining 25.5% of the variation in rhizosphere bacterial community composition (Supporting Figure. 1). Together, these findings indicate that domestication status is a major determinant of rhizosphere microbial community structure across the barley genotypes.
To enable a deeper and genome-resolved analysis of the microbial communities associated with barley domestication, we next selected a representative subset of genotypes for whole metagenome sequencing (WMS). Based on the ordination patterns and the observed community divergence across domestication groups, two genotypes each from the wild (HID0144 and HID0380) and landrace (HID1029 and HID1104) groups, and one genotype from the modern group (Gretchen) were chosen for high-resolution long read Oxford Nanopore (ONT) sequencing. This targeted selection allowed us to capture the wealth of microbiome variation revealed by short-read profiling while enabling an in-depth understanding of the microbial communities that shape barley genotypes.
Oxford Nanopore long-read metagenome sequencing of rhizosphere microbiome
The use of long-read sequencing offers a distinct advantage for complex soil microbiomes, as it improves assembly continuity, gene-level annotation, and recovery of complete biosynthetic gene clusters [82]. In our study, ONT sequencing of barley rhizosphere microbiome samples across 2024 and 2025 produced high-quality long-read data suitable for downstream metagenomic analysis. In 2024, the mean read length ranged between approx. 2.4 to 4.9 kb, with average Phred quality scores of about 15 (Fig. 1A). Similarly, in 2025, mean read length varied between 2.3 and 3.5 kb, and mean quality scores remained above 15 across all samples (Fig. 1B). The sequencing depths expressed as the total number of reads per sample, ranged between 0.5 to 1.3 million reads in 2024, and 0.3 to 1 million reads in 2025. Total sequencing yield, represented by the sum of bases generated, varied from 2.6 to 4.5 Gb in 2024 and 0.7 to 3.8 Gb in 2025 (Figs. 1C and D). The summary statistics of WMS runs from 2024 and 2025 are provided in Supporting Tables S2 and S3.
We further assessed the proportion of classified and unclassified reads across all samples using Kraken2 in Galaxy. The fraction of classified to unclassified reads differed largely between the bacterial and fungal datasets. For bacteria, the prebuilt standard Kraken2 database successfully classified approx. 30% of the reads in 2024 and 2025. In contrast, fungal reads showed lower classification rates. Testing several fungal reference databases modestly improved assignment, but variability among databases prompted us to use the standard fungi reference genome database available in Galaxy for final taxonomic classification. The remaining unclassified reads likely reflect the limited representation of fungal genomes in current reference libraries. Of the classified reads, we also compared the proportions of bacterial and fungal sequences. Across all samples, bacterial reads predominated, accounting for approx. 59–73% and 63–68% of total classified reads in 2024 and 2025, respectively (Figs. 1E and F). These findings indicate that ONT metagenomic sequencing revealed higher bacterial richness than fungal diversity in the rhizosphere, consistent with previous studies reporting that fungal sequences are underrepresented in metagenomic databases, limiting taxonomic accuracy [83].
Taxonomic composition of the barley rhizosphere microbiomes reveals genotype-dependent community shifts
The rhizosphere microbiome plays an important role in plant growth, nutrient turnover, and stress resilience [15, 84]. The composition and structure of root-associated microbial communities are key determinants of plant fitness [85] and have strongly been influenced by processes of domestication and breeding. To investigate genotype-specific microbial community structures and their diversity across seasons, rhizosphere samples from wild accessions HID0144 and HID0380, landraces HID1029 and HID1104, and the modern cultivar Gretchen were analyzed at different taxonomic ranks (Fig. 2).
At the phylum level, the rhizosphere bacterial communities of different barley genotypes were dominated by Pseudomonadota and Actinomycetota, which together accounted for the majority of reads across both field seasons. These two phyla formed a stable microbiome shared among wild, landrace, and modern barley genotypes. Temporal variation was evident, with Actinomycetota increasing in relative abundance from 12.1% in 2024 to 27% in 2025 (Figs. 2A and B). At the genus level, taxa including Nocardioides, Bradyrhizobium, and Streptomyces were consistently dominant across all barley types. While these genera were consistently present across all samples, their relative abundance varied markedly among genotypes and between years. Interestingly, between years, the relative abundance of Streptomyces increased in Gretchen, from 3.5% in 2024 to 14.1% in 2025, suggesting temporal shifts in this actinobacterial genus (Figs. 2C and D). In contrast, Bradyrhizobium declined by approximately 10% over the same period, possibly reflecting environmental influences on nitrogen-fixing microbial populations. These trends highlight shifts in rhizosphere bacterial composition influenced by both host genotype and environmental changed between years. Such genotype-dependent patterns suggest that host signaling may actively shape microbial recruitment, consistent with previous findings in cereals where host genetics governs microbial assembly [11, 21].
In genus-level profiles, fungal reads represented only a minor fraction of total microbial reads, consistent with lower taxonomic richness in fungi than in bacteria. Correspondingly, the number of fungal genera in each sample was substantially lower than that of the bacterial genera. Among fungi, only Fusarium, Aspergillus, Cryptococcus and Kluyveromyces were consistently observed. Of these, Fusarium dominated, contributing on average of 92.4% and 79.6% of fungal reads in 2024 and 2025, respectively (Figs. 2E and F). As shotgun metagenomics quantifies DNA, the disproportionately low fungal read counts and genus richness support the interpretation that fungal propagules are relatively less prevalent than bacteria in rhizosphere samples [86, 87].
To compare compositional shifts at the species level, we performed two complementary WMS analyses that identified genera with high internal diversity and strong changes in abundance. This approach revealed the taxa most enriched or depleted relative to the control. Genera such as Pseudomonas and Streptomyces consistently exhibited high species richness across all barley types, reflecting their widespread association in the rhizosphere. However, the number of species within these genera varied between years. For instance, an average of 23 Streptomyces species were detected in 2024, increasing to 71 in 2025, and Pseudomonas species increased from 32 to 46 during the same period (Figs. 2G and H). Differential abundance analysis revealed clear contrasts among host genotypes and between years. In both years, less diverse genera exhibited stronger enrichment relative to control soil, highlighting the functional contribution of rare taxa to community composition (Figs. 2I and J). Interestingly, plant growth-promoting bacteria such as Devosia, Neorhizobium, and Aeromicrobium were detected predominantly in the rhizosphere of 2024 (Fig. 2I), whereas Kosakonia and Enterobacter were more abundant in 2025. The modern cultivar Gretchen displayed higher levels of Erwinia, Enterobacter, and Tardiphaga in 2025 (Fig. 2J). These dramatic shifts in non-dominant, but functionally active taxa suggest intense recruitment patterns shaped by host genotype and environmental variation.
In order to compare the shared and unique bacterial genera among barley groups, genus-level data were categorized into four groups including control, wild accessions, landraces, and elite cultivar. A genus was considered present within a category if detected in at least one sample from that group, and only these presence-based genera were used to compute shared and unique sets for Venn analysis. In both years, a substantial number of taxa was shared across all barley types and the control soil, comprising 104 and 96 genera in 2024 and 2025, respectively (Figs. 2K and L; Supporting Tables S4 and S5). Despite this common core, distinct sets of genera were unique to each category, indicating genotype- and year-specific associations. Wild accessions from 2024 and landraces from 2025 comprised the highest number of unique genera accounting to 26 each, whereas the elite cultivar Gretchen contained only eight across both years. This pattern suggests that wild accessions recruit a broader but more variable microbiome, while domestication has favored a narrower and more stable assemblage of bacterial lineages.
Taken together, these results indicate that distinct barley genotypes shape and support characteristic rhizosphere microbiomes. While the overall community structure remained conserved across genotypes, consistent with a shared core microbiome, distinct abundance patterns highlight that host genotype exerts a measurable influence on rhizosphere composition, driving differential recruitment and adaptation of specific bacterial lineages in the rhizosphere.
Rhizosphere microbial alpha- and beta-diversity
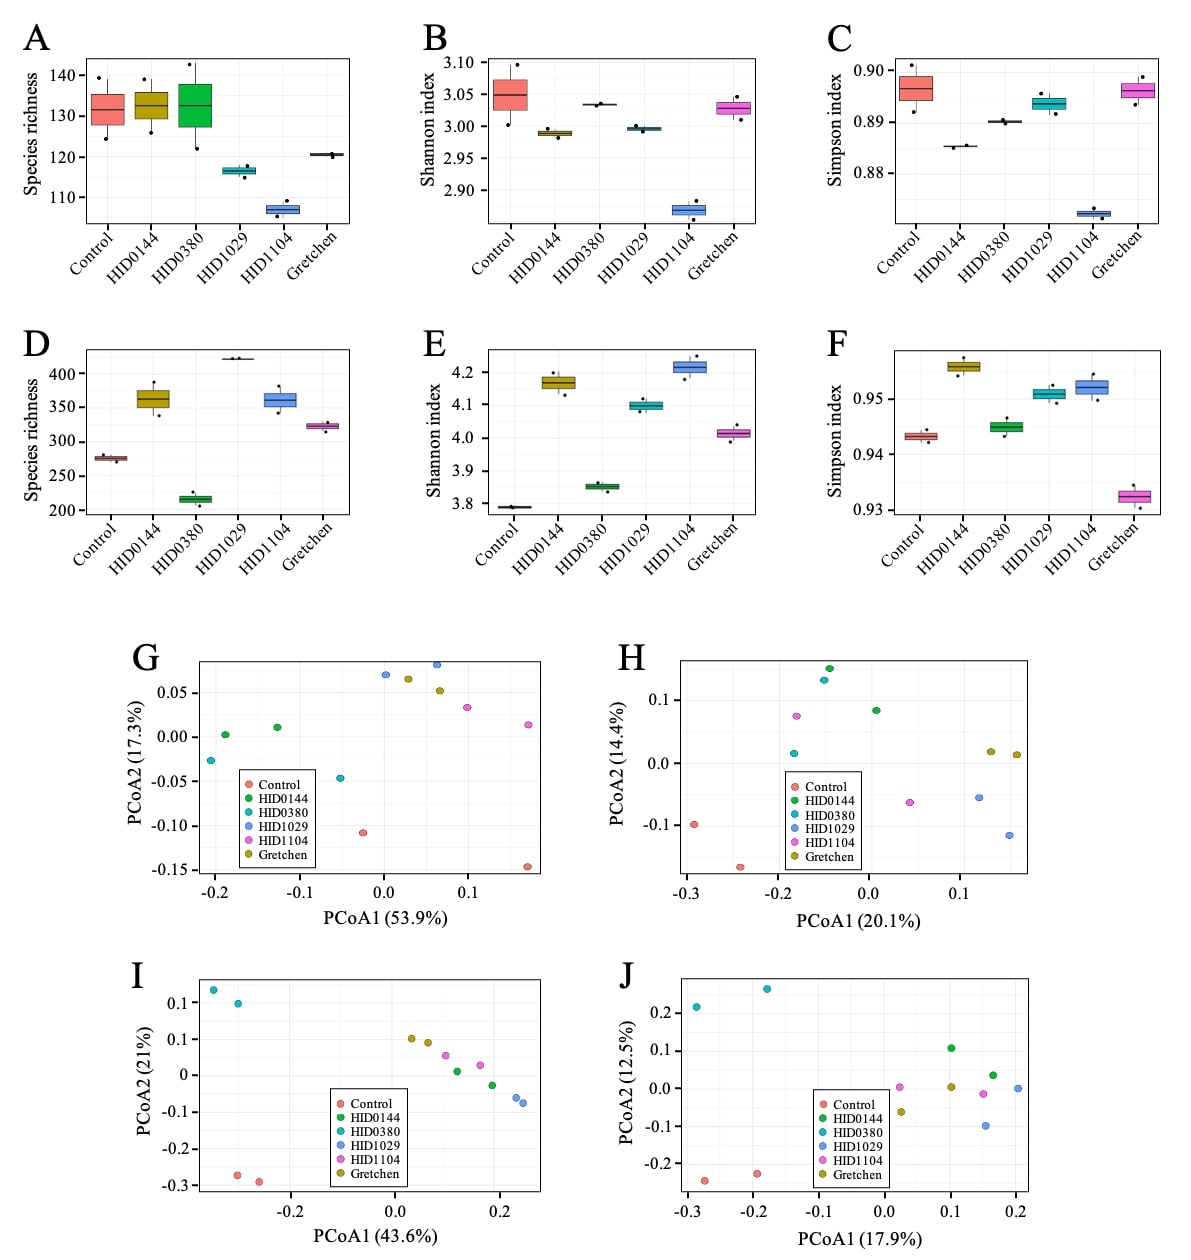
Alpha and beta diversity analyses were performed on WMS-derived bacterial profiles to assess within (alpha) and between-sample (beta) variation across barley genotypes in 2024 and 2025. Alpha diversity indices, including species richness (Supporting Figs. 2A and D), Shannon (Supporting Figs. 2B and E), and Simpson (Supporting Figs. 2C and F), showed no significant differences among groups (Kruskal-Wallis, p > 0.05; Richness: χ² = 9.59, p = 0.0877 in 2024 and χ² = 10.50, p = 0.0623 in 2025), indicating comparable overall community diversity. On average, 100–150 bacterial genera were detected in 2024, whereas 2025 samples showed higher richness (220–450 genera) (Supporting Figs. 2A and D), consistent with a more complex rhizosphere community. Wild accessions tended to display slightly higher richness than landraces and the modern cultivar, suggesting modest but non-significant trends consistent with early observations that domestication can narrow rhizosphere diversity [11]. Beta diversity analyses revealed clear genotype- and year-dependent community differences. Principal Coordinate Analysis (PCoA) based on Bray-Curtis and Jaccard distances showed distinct clustering by genotype and year, indicating strong compositional differences, similar to patterns observed in maize and rice [17, 88]. PERMANOVA confirmed significant variation among groups (Bray-Curtis: R² = 0.79, F = 4.64, p = 0.001 in 2024, Supporting Fig. 2G; R² = 0.93, F = 16.91, p = 0.001 in 2025, Supporting Fig. 2I). In addition, Jaccard-based comparisons supported these findings (R² = 0.60, F = 1.84, p = 0.001 in 2024, Supporting Fig. 2H; R² = 0.56, F = 1.54, p = 0.001 in 2025, Supporting Fig. 2J), and homogeneity of dispersion tests confirmed that these dissimilarities were not driven by unequal variance among groups. Together, the diversity metrics confirm genotype-dependent community composition, with stronger divergence in 2025 suggesting additional genotype-by-environment effect on microbial recruitment.
Functional profiling of the microbiome reveals conserved yet genotype-specific enrichment of microbial pathways across barley genotypes
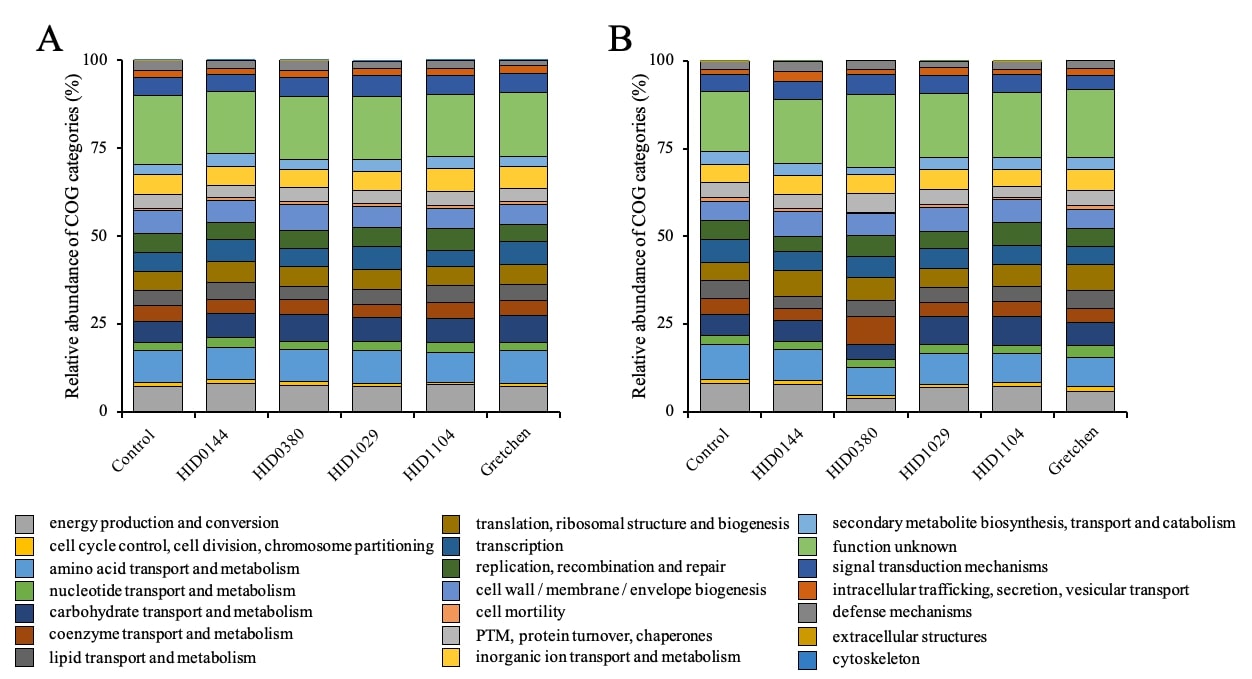
To understand whether genotype-dependent community shifts correspond to functional differences, metagenomic assemblies were annotated with eggNOG-mapper to obtain COG and KEGG classifications. COG profiles showed highly consistent functional compositions across genotypes and years, indicating a stable core metabolic structure of the rhizosphere microbiome (Supporting Fig. 3) [89]. The dominant categories across all samples included amino acid transport and metabolism, energy production and conversion, and cell wall-related biogenesis, with ~ 20% of proteins annotated as hypothetical, reflecting the prevalence of uncharacterized microbial functions. Although the total number of predicted proteins varied among genotypes and years, the proportional representation of COG categories remained comparable, suggesting that functional capacities were largely conserved despite taxonomic differences (Supporting Table S6).
To further understand the specific biochemical pathways involved in the rhizosphere microbial activity, KEGG pathway enrichment analysis was performed on the annotated protein datasets. Across both years, microbial communities from all genotypes exhibited broad enrichment of core metabolic processes, including amino acid metabolism, energy metabolism and secondary metabolite (SM) biosynthesis (Figs. 3A and B). In 2024 and 2025, an average of 531 and 487, 602 and 348, 555 and 518, and 473 and 379 pathways were enriched in control soil, wild accessions, landraces and the modern cultivar Gretchen, respectively (Supporting Table S6). Although most pathways were shared among genotypes, the relative enrichment varied systematically among wild, landrace, and modern types, indicating that host genotype not only shapes microbial composition but also selects for distinct metabolic functions within the rhizosphere. In 2024, the wild accession HID0380 displayed strong enrichment in amino acid and sugar metabolism, whereas its closest related counterpart HID0144 showed higher enrichment in glyoxylate and dicarboxylate metabolism (Fig. 3A). The landraces HID1029 and HID1104 exhibited moderate but balanced enrichment across most pathways. Interestingly, HID1029 showed a moderate enrichment in glycolysis or gluconeogenesis, while HID1104 was enriched in ATP-binding cassette (ABC) transporters and amino acid metabolism of glycine, serine and threonine. The modern cultivar Gretchen displayed a strong enrichment in quorum sensing as well as amino acid biosynthesis, suggesting that microbial communities in its rhizosphere may be more specialized in signaling and metabolic exchange [90]. The dataset from 2025 revealed distinct differences in functional enrichment patterns (Fig. 3B), with an overall higher diversity of enriched pathways compared with 2024. The wild accession HID0144 showed pronounced enrichment in carbon fixation pathways, while HID0380 was enriched in alanine, aspartate and glutamate metabolism, indicating an increased emphasis on nitrogen assimilation and amino acid turnover. The landraces maintained moderate yet broad enrichment across all major pathways, displaying a similar metabolic profile between HID1029 and HID1104. Interestingly, Gretchen exhibited an altered enrichment pattern relative to its previous year, with elevated activity across aminoacyl-tRNA biosynthesis, ABC transporters and pyrimidine metabolism, implying enhanced translational and transport process in its microbiome. Across both years, pathways with antibiotic biosynthesis and SM production were consistently enriched in different genotypes. This pattern points to a metabolically competitive and chemically dynamic rhizosphere environment, where microbial taxa likely engage in both antagonistic and cooperative interactions that shape community structure and potentially contribute to plant protection. Collectively, the functional profiling demonstrates that while core metabolic capacities are conserved across barley genotypes, differential pathway enrichment reveals host-specific microbial adaptation, underscoring the genotype’s influence on microbiome function.
Metagenome-assembled genomes (MAGs) reveal the taxonomic structure and recovery quality of the barley rhizosphere microbiome
To extend beyond community-level inference and understand genome-resolved diversity, we reconstructed metagenome-assembled genomes (MAGs) from the long-read metagenomic datasets obtained in 2024 and 2025. A total of 445 MAG bins were recovered across all samples, representing genome fragments derived from diverse bacterial lineages (Fig. 4A). The number of reconstructed MAGs varied between samples and years, ranging from 200 and 153 in Control, 153 and 98 in HID0380, 201 and 190 in HID0144, 98 and 233 in HID1029, 212 and 191 in HID1104, and 190 and 143 in Gretchen over 2024 and 2025, respectively. Quality assessment based on CheckM revealed that the majority of MAGs exhibited low completeness (< 50%), with only about 20 bins exceeding this threshold (Fig. 4B). Such fragmentation is characteristic of soil metagenomes, where high species richness, uneven sequencing depth, the intrinsic error profile of nanopore reads, and strain-level complexity limit the recovery of near-complete genomes [91, 92]. Taxonomic classification using GTDB-Tk enabled assignment of MAGs at different ranks, with the number of classified bins increasing from domain to genus level (Fig. 4C). Approximately 15, 23, 27, and 36 distinct phyla, orders, families, and genera were recovered, while only 2 species-level MAGs were identified, reflecting the limited number of high-quality assemblies. A subset of MAGs remained unclassified at lower taxonomic levels, likely due to incomplete marker sets or absence of closely related reference genomes. The most represented bacterial phyla were Pseudomonadota, Actinomycetota, Bacteroidota, and Acidobacteriota, together encompassing the majority of recovered MAGs (Fig. 4D). Among these, Pseudomonadota and Actinomycetota dominated, accounting for 25 and 22 of all bins, respectively. Members of these groups are frequently associated with plant-associated microbiomes and include metabolically versatile taxa capable of stress adaptation, SM production, and organic matter turnover [13, 93, 94]. To further resolve evolutionary relationships, a phylogenetic cladogram was constructed using the 16S rRNA genes identified within 93 MAGs (Fig. 4E). The 16S-based tree revealed well-defined clusters corresponding to the four dominant phyla, confirming taxonomic assignments and illustrating the genomic diversity within each lineage. Genera such as Bradyrhizobium, Chitinophaga, Flavobacterium, Nocardioides, and Streptomyces were among the most represented. The close phylogenetic grouping of these taxa underscores their ecological coherence and prevalence within the barley rhizosphere. Collectively, these results demonstrate that genome-resolved metagenomics enabled recovery and taxonomic placement of bacterial genomes from complex rhizosphere communities, highlighting the predominance of Actinomycetota, Pseudomonadota, and Bacteroidota lineages and revealing fine-scale phylogenetic structure through 16S-based analysis.
Transcriptional response of barley roots to distinct microbiomes
In order to investigate the genotype-specific transcriptional response of H. vulgare roots to distinct microbiome compositions, total mRNA was isolated from root tissues of five barley genotypes in 2025, including wild accessions HID0144 and HID0380, landraces HID1029 and HID1104 and modern cultivar Gretchen. As a control, the high yielding cultivar Gretchen was grown under greenhouse conditions in pots containing sterilized field soil to exclude microbial influence. Two independent biological replicates were analyzed for each genotype, yielding 12 libraries. The ONT sequencing generated approx. 12 million raw reads, of which 10.8 million high-quality reads were retained after trimming. On average, 90% of these clean reads were successfully mapped to the reference genome of H. vulgare Morex v3, corresponding to a total of 35,106 genes. Differentially expressed genes (DEGs) were identified using a significance threshold of p < 0.05 and a fold change (FC) cutoff of > 2 for increased and < 0.5 for decreased transcript abundances.
Principal Component analyses (PCA) showed tight clustering of biological replicates within each genotype, indicating uniformity and high reproducibility of transcriptome profiles, whereas clear separation among genotypes reflected distinct transcriptional signatures (Fig. 5A). This pattern was further supported by a heatmap of the correlation matrices, with samples clustering based on normalized transcript counts (Fig. 5B). The number of DEGs varied among genotypes with 1,266, 1,844, 1,941, 1,657 and 1,384 DEGs identified in HID0144, HID0380, HID1029, HID1104 and Gretchen, respectively. Of the 1,266 and 1,844 DEGs of the wild accessions HID0144 and HID0380, 808 and 1757 genes showed increased and 458 and 87 exhibited decreased transcript abundances, respectively. Interestingly, HID0380 had more than twice the number of transcriptionally induced up-regulated genes compared with HID0144. The landraces HID1029 and HID1104 showed 1,188 and 893 genes with increased expression and 753 and 764 genes with reduced expression, respectively. In the modern cultivar Gretchen, 1,067 genes were up- and 317 were down- regulated (Fig. 5C). The in-detail summary of the DEGs in all samples are provided in the Supporting Tables S7 - S11. DEGs were functionally categorized using Mercator, revealing strong representation of enzyme-related functions, followed by categories linked to chromatin organization and RNA biosynthesis. Several DEGs were also assigned to functional groups involved in translational processed, including protein homeostasis, biosynthesis and modification (Fig. 5D). Intriguingly, the Venn plot illustrated genotype-specific transcriptional signatures, identifying 11, 463, 189, 61 and 44 unique up-regulated genes and 166, 13, 295, 256 and 56 unique down-regulated genes in HID0144, ID0380, HID1029, HID1104 and Gretchen, respectively (Figs. 5E and F; Supporting Tables S12 and S13). Notably, the number of shared up-regulated genes across genotypes were approx. tenfold higher than shared down-regulated genes. These results indicate that barley genotypes activate distinct transcriptional responses towards different microbial consortia, highlighting the ability of individual genotypes to respond distinctively to varying microbiome compositions. This correspondence between microbial variation and host transcriptional response suggests a feedback mechanism whereby genotype-specific microbiomes elicit tailored molecular programs in the host, reinforcing the genotype-microbiome linkage.
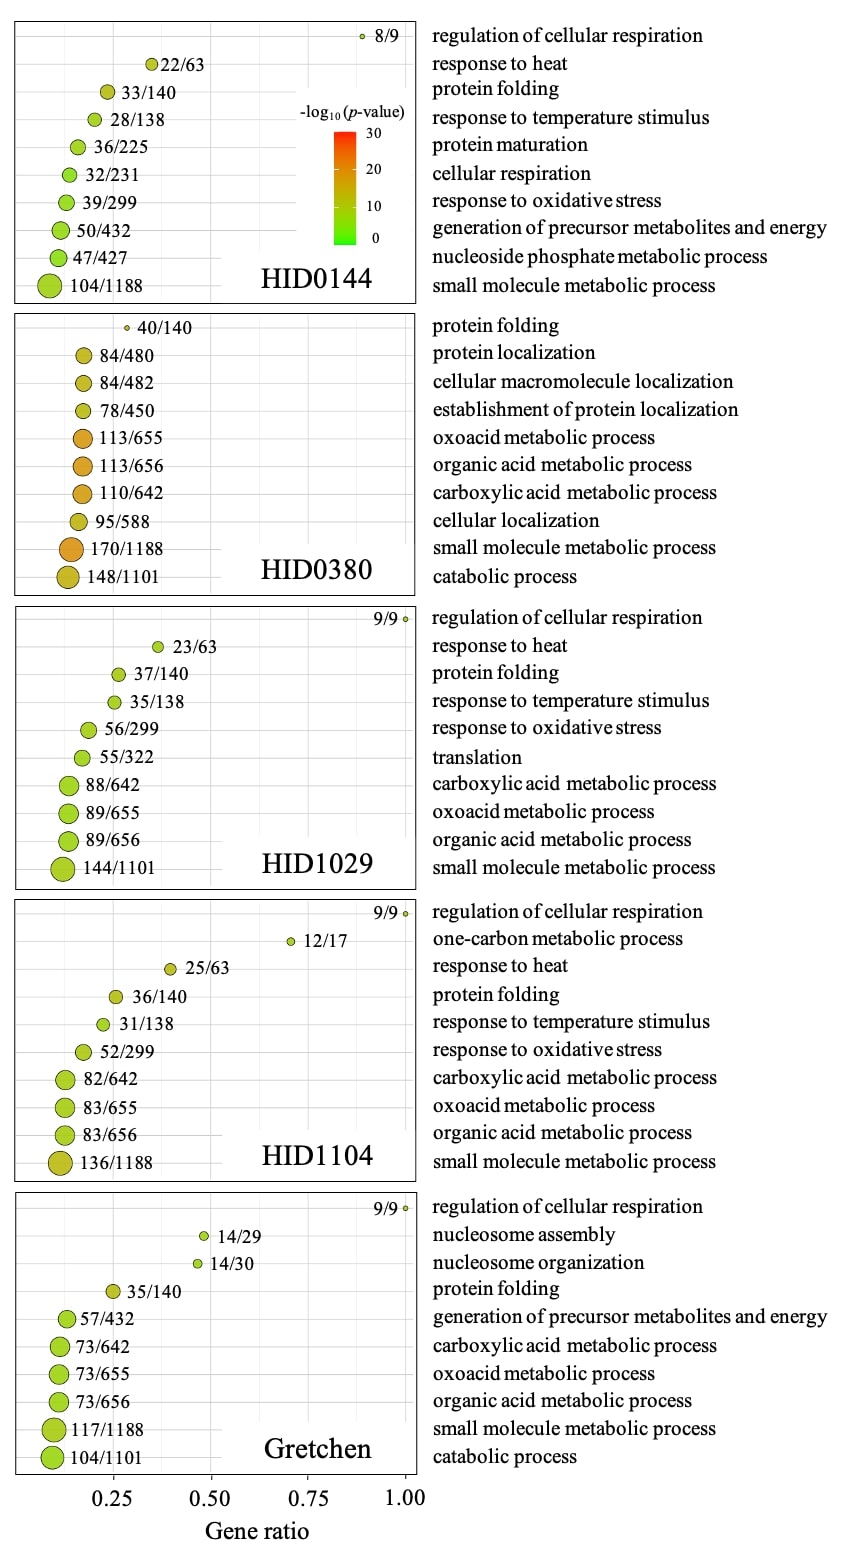
To assess functional patterns among differentially expressed genes, gene ontology (GO) enrichment analysis was performed using the biological process (GO:BP) category. The top enriched terms revealed both shared and genotype-specific responses of barley roots to distinct microbiomes (Supporting Fig. 4; Supporting Table S14). Core processes such as response to stress, small-molecule metabolism, regulation of respiration, and translation-associated functions were consistently enriched across all genotypes. Genotype-specific differences were also evident as HID0144 showed enrichment in nucleoside phosphate metabolism, HID0380 and Gretchen were enriched in catabolic processes, and the landraces displayed similar but quantitatively variable enrichment profiles. The elite cultivar Gretchen additionally showed enrichment related to nucleosome organization, suggesting chromatin-associated regulation. Overall, while major biological processes were conserved, variation in pathway enrichment reflects subtle yet distinct transcriptional programs shaped by genotype and associated microbiomes.
Host transcriptional activation coordinates with microbial signaling in the barley rhizosphere
In order to investigate the transcriptional response of barley roots to distinct microbial communities, DEGs were classified into eight biological categories based on Mercator annotation. These categories were selected for their relevance to plant-microbe interactions, and included transporters, secondary metabolism, redox reactions, receptor-like protein kinases (RLKs), hormone signaling, pattern recognition receptors (PRRs) and nucleotide-binding leucine-rich repeat receptors (NLRs), defense-related regulatory proteins, and cell wall organization (Fig. 6A; Supporting Table S15). Overall, all genotypes exhibited a higher proportion of upregulated genes across most categories, indicating an active transcriptional reprogramming in response to the microbiome. Among the wild accessions, HID1104 and HID0380 showed 171 and 445 DEGs with increased, and 60 and 9 DEGs with decreased transcript abundance, respectively. Notably, HID0380 displayed the strongest transcriptional activation, with 172 and 91 upregulated genes belonging to defense-related regulatory proteins and transporters, respectively. In contrast, only 5 and no downregulated genes were detected in the same category. This highlights the presence of dramatic transcriptional activation in HID0380 taking place in response to the associated microbiota. The landraces HID1029 and HID1104 displayed comparable enrichment patterns, with 250 and 199 upregulated DEGs, respectively. Both genotypes showed a substantial number of regulatory proteins associated with defense, with 82 and 58 DEGs with increased, and 50 and 56 with decreased transcript abundance. The modern cultivar Gretchen showed a total of 253 and 57 up- and down-regulated DEGs, including approx. 110 genes with increased activity belonging to the defense-related regulatory proteins category. Across all genotypes, other plant immunity-related groups including PRRs / NLRs, RLKs and secondary metabolism also contained a substantial number of DEGs, though their representation varied among genotypes.
As the different plant gene categories associated with microbial interactions and signaling showed pronounced transcriptional activation, we decided to look into the protein families within the rhizosphere microbiome from 2025 to understand how microbial communities may respond to host-derived cues. The Pfam-based analysis revealed a conserved set of protein families broadly represented across all samples, suggesting a shared molecular repertoire underlying microbial functionality in the barley rhizosphere. Pfam-based domain annotation identified a total of 537, 682, 62, 4008, 543 and 212 functional domains across control, HID0144, HID0380, HID1029, HID1104 and Gretchen, respectively. Each Pfam count represents the number of predicted proteins containing a specific conserved domain within a sample (Supporting Table S16). The most abundant domains included response regulators, histidine kinases, ABC transporter, and major facilitator superfamily proteins, which are key components of bacterial signal transduction and substrate transport (Fig. 6B) [95, 96]. Their consistent enrichment across all barley genotypes suggests that rhizosphere microbes actively sense and respond to plant-derived chemical cues. Interestingly, domains related to redox regulation, including PAS (Per-Arnt-Sim) domain and radical SAM (S-adenosyl-L-methionine) superfamily members, as well as energy-driven transport processes such as ATPases and enoyl-acyl carrier protein reductases, were also highly represented, reflecting strong microbial integration with plant roots. In addition, the prevalence of signal transduction and transporter-associated Pfam families across samples indicates active microbial communication aligned with host signaling. This reciprocal regulation underscores a sophisticated molecular dialogue between barley and its microbiome [97], forming a dynamic communication network that supports rhizosphere resilience and metabolic balance. The connection between host defense and microbial signaling pathways implies that barley genotypes not only shape but also dynamically co-regulate their microbiomes, reflecting a co-adaptive relationship that likely contributes to genotype-specific performance under natural conditions.
Genomic variation at a pathogen defense-related locus reveals structural divergence among barley genotypes
Given the strong transcriptional activation of defense-related regulatory proteins, we further examined whether variation in the underlying genomic loci could help explain these responses. Among the eight functional categories associated with plant-microbe interactions, defense-related regulatory proteins contained the highest number of upregulated genes across all genotypes. UniProt annotation of 21 commonly upregulated genes revealed consistent activation of protease inhibitors, ubiquitin-proteasome components, and molecular chaperones such as BAG-domain proteins and calreticulin, all of which contribute to proteostasis during stress. Notably, two of the most highly expressed genes, HORVU.MOREX.PROJ.1HG00003980.1 (BPGv2) and HORVU.MOREX.PROJ.1HG00011330.1 (BPGv2), encode subtilisin/chymotrypsin inhibitor 2A proteins, typically induced during pathogen challenge and central to protease-mediated immunity [98]. Because these genes showed strong transcriptional response across all genotypes, we investigated whether genomic structural variation at these loci may contribute to the observed differences in expression or microbial response. Examination of the barley pangenome (BPGv2), together with ONT genome sequencing of our five genotypes, revealed that the two inhibitor genes are paralogs and vary in copy number. PanBarlex (https://panbarlex.ipk-gatersleben.de/) [8] analysis showed that Morex carried two paralogous copies, while the wild accession HID0380 contains 16 homologous gene copies within a ~ 600 Kbp cluster, indicating substantial expansion of this defense-associated locus.
To quantify structural divergence in more detail, we applied alignment-free k-mer profiling using GeneToCN [78]. The statistical summary of ONT genomic sequencing is provided in Supporting Table S17. Of the two target genes, only HORVU.MOREX.PROJ.1HG00003980.1 provided sufficient informative k-mers for reliable analysis, and we therefore focused on this locus. Median gene-region k-mer depth varied strongly among genotypes, with HID0380 showing the highest depth, consistent with multiple Morex-like copies, whereas HID0144 showed near-zero depth, suggesting absence or extreme divergence of the Morex allele (Fig. 7A). Other genotypes displayed low to moderate similarity to the reference. To distinguish divergence within the gene from that of the surrounding locus, we separated 25-mers matching the Morex coding sequence (gene-specific) from those derived from the flanking region (flank-specific). All genotypes except HID0144 retained all 30 gene-specific 25-mers, indicating that the coding region itself is structurally conserved. In contrast, flank-specific k-mers showed substantial variation with HID1029 retaining 1202 k-mers, indicating highest similarity, whereas HID0380, HID1104 and Gretchen retaining only 12–26 such k-mers (Fig. 7B). Pairwise comparisons (Fig. 7C) of locus-wide k-mer sets and hierarchical clustering (Fig. 7D) further resolved these relationships. HID0380 and HID1029 formed the closest pair, HID1104 and Gretchen displayed intermediate similarity, while HID0144 was clearly separated from other genotypes. Spatial visualization of k-mer abundance reflected the depth of Morex-derived 25-mers at each genomic position across the 30 gene-specific k-mers, thereby indicating the relative dosage of Morex-like sequence. This visualization revealed a sharp coverage peak at the gene region for HID0380, reaching a maximum depth of 29, whereas HID1029, HID1104 and Gretchen showed progressively lower depths of 4, 9 and 3, respectively (Fig. 7E). To determine whether this structural variation was accompanied by nucleotide-level divergence, we performed read-based SNP calling across HORVU.MOREX.PROJ.1HG00003980.1 (Supporting Table S18). SNP frequencies varied among genotypes, with HID0380 showing the highest number (6 SNPs), and forming at least two distinct haplotype groups, suggesting potential sub-functionalization among its duplicated copies. The landrace HID1104 displayed 4 SNPs, followed by the genotypes HID0144, HID1029 and Gretchen each showing 3 SNPs (Fig. 7F). To assess the positional distribution of these variants, genotype-specific consensus sequences were aligned to Morex and visualized as a per-base match / SNP profile across the 224 bp region of the gene. This revealed that SNPs were mostly uniformly distributed except for the wild accession HID0380, which showed a slightly variable pattern with base substitutions (Fig. 7G). Together, these results indicate that, although the subtilisin-chymotrypsin inhibitor gene HORVU.MOREX.PROJ.1HG00003980.1 is structurally conserved across barley genotypes, both k-mer patterns and nucleotide-level polymorphisms reveal genotype-specific copy-number and sequence variation that likely contribute to the observed transcriptional variation.
Collectively, our multi-omics approach using long-read nanopore sequencing shows that distinct barley genotypes actively shape both the structure and function of their rhizosphere microbiomes. Genotype dependent shifts in community composition were accompanied by conserved metabolic functions with changes in associated pathways indicating genotype-specific functional changes within the microbiome. In addition, host transcriptional activation of defense, signaling, and metabolic processes paralleled microbial enrichment in transporter and signaling domains, revealing a genotype-dependent communication network that sustains rhizosphere stability. Together with the strong structural divergence observed at a pathogen defense-related locus, these findings link plant genomic variation to transcriptional deregulation and microbiome composition, highlighting barley genotypes as a driver shaping the ecological structure and functionality of the rhizosphere microbiome.