Study Population
A total of 583 patients with FLT3-mutated AML were initially identified and fulfilled the inclusion criteria. After excluding 17 duplicates patients and 1 patient with a rare acute promyelocytic leukemia transcript, the analyzed cohort comprised 565 patients. The overall study design and patient flow are illustrated in the flow chart diagram (Figure 1). The characteristics of these 565 patients are detailed in Table 1. Among them, 65.7% (371) received intensive chemotherapy without midostaurin (IC group), collected between January 2005 and June 2017, and 34.3% (194) received IC combined with midostaurin (IC+MIDO group), collected between June 2017 and August 2023.
The median age for the entire cohort was 67.5 years (range: 60.0-81.4 years), with 35.6% (201) aged ≥70 years. Males constituted 52.2% of the patients, and 19% had secondary AML. Regarding cytogenetic risk according to the MRC classification, the majority of patients (93.1%) belonged to the intermediate-risk group.
FLT3-ITD mutations were present in 85.5% (483) of patients. Significant baseline differences were observed between the IC and IC+MIDO groups (Table 1). The IC group had a higher median white blood cell count (WBC) (54.9 × 10⁹/L [IQR, 18.2–133.2] vs. 25.4 × 10⁹/L [IQR, 6.3–96.6] for IC+MIDO; p < 0.001), a greater proportion with ECOG performance status ≥ 2 (27.2% vs. 13.4%; p < 0.001), and a higher prevalence of FLT3-ITD mutations (88.7% vs. 79.4%; p = 0.002). The prevalence of FLT3-TKD mutations, identified in 21.5% (98) of the cohort, did not significantly differ between groups (19.5% in IC vs. 24.2% in IC+MIDO; p = 0.229). NPM1 mutations, found in 61.4% (341) of patients, were also similarly distributed (58.8% vs. 66.5%; p = 0.076).
Induction Chemotherapy, Response Rates, and Consolidation Therapy
The induction chemotherapy regimens are detailed in Supplementary Table S1. Predominantly, idarubicin-based regimens were administered, with idarubicin plus cytarabine ("7+3") given to 48.3% (273) of patients, and idarubicin "7+3" combined with lomustine (CCNU) to 32.4% (183) of patients. Gemtuzumab ozogamicin was added to an idarubicin-based regimen for 3 patients. Daunorubicin-based regimens were used in 8.9% (50) of patients, which included standard daunorubicin "7+3" for 6.2% (35) and CPX-351 for 2.7% (15). Others intensive chemotherapy regimens were administered to 3.7% (21) of patients.
After excluding 7 patients who died before day 8 of induction (all from the IC group), early death (ED) rates were significantly lower in the IC+MIDO group compared to the IC group. ED by day 30 occurred in 3.6% (7) of IC+MIDO patients versus 16.2% (59) of IC patients (p<0.0001). Similarly, ED by day 60 was 8.2% (16) in the IC+MIDO group versus 21.4% (78/364) in the IC group (p<0.0001).
Following one cycle of first-line induction chemotherapy, the composite complete remission (CRc) rate, defined as CR plus CRi, was significantly higher in the IC+MIDO group at 78.9% (153) compared to 63.1% (234) in the IC group (p<0.0001). Detailed responses are presented in Table 2. The overall response rate (ORR; CRc + partial remission [PR]) was 80.9% (157) for IC+MIDO versus 66.6% (247) for IC. Failure of one cycle of first-line induction chemotherapy (progression or stable disease) was comparable between the IC+MIDO group (13.4%; 26) and the IC group (14.6%; 54). Absence of response evaluation after induction was significantly less frequent in the IC+MIDO group (4.6%; 9) compared to the IC group (18.9%; 70; p<0.0001).
Multivariable logistic regression analysis showed that midostaurin treatment was independently associated with an increased likelihood of achieving CRc (aOR 1.97, [95% CI: 1.29–2.98], p=0.002). In contrast, age ≥70 years (aOR 0.61, [95% CI: 0.42–0.89], p=0.010), ECOG ≥2 at diagnosis (aOR 0.64, [95% CI: 0.41–0.99], p=0.047), and adverse cytogenetic risk (aOR 0.39, [95% CI: 0.19–0.83], p=0.015) were each associated with a reduced likelihood of achieving CRc (Table 3).
Consolidation therapy was administered to patients achieving CRc (N=387). I/HDAC regimens were received by 230 patients: 124 in the IC group and 106 in the IC+MIDO group. The median number of I/HDAC cycles was 2 (range: 1-3) in the IC group and 2 (range: 1-4) in the IC+MIDO group; patients in the IC+MIDO group tended to receive a greater number of cycles (p=0.003). Less intensive outpatient mini-consolidations were administered to 105 patients: 74 in the IC group and 31 in the IC+MIDO group. The median number of mini-consolidation cycles was 4 (range: 1-7) in the IC group and 5 (range: 1-7) in the IC+MIDO group, with no significant difference observed (p=0.272). Autologous stem cell transplantation was performed in 4.7% (18) CRc patients. Allogeneic HSCT was performed in 18.0% (35) of patients in the IC+MIDO group compared to 10.8% (40) in the IC group (p=0.015). Patients in the IC+MIDO arm achieving remission continued midostaurin during consolidation cycles.
MAINTENANCE
A total of 61 patients initiated maintenance therapy with midostaurin. Among the 106 patients who started consolidation chemotherapy, 55,7% (59) subsequently proceeded to midostaurin maintenance. Additionally, of the 35 patients who underwent allogeneic HSCT, 17.1% (6) received post-transplant maintenance with midostaurin.
Outcomes
To mitigate potential bias from differing follow-up durations between treatment groups, patients in the IC group were censored at 60 months for comparative survival analyses. The median follow-up for the entire cohort, after this censoring, was 46.0 months (IQR, 31.5-60.0 months).
Overall survival (OS) was significantly improved in the IC+MIDO group compared to the IC group (p<0.0001; Figure 2A). The median OS was 24.2 months (IQR, 10.5-NR) for the IC+MIDO group versus 8.6 months (IQR, 2.4-21.7) for the IC group. One-year, 3-year, and 5-year OS rates for the IC+MIDO group were 69.0%, 44.6%, and 40.6%, respectively, compared to 38.1%, 18.9%, and 12.9% for the IC group.
In the subgroup of patients <70 years (n=364), median OS was 36.4 months (IQR, 11.8-NR) with IC+MIDO versus 8.9 months (IQR, 3.1-23.5) with IC (p<0.0001; Figure 2B). For patients aged ≥70 years (n=201), median OS was 16.3 months (IQR, 5.6-NR) with IC+MIDO versus 7.8 months (IQR, 1.7-20.1) with IC (p=0.003; Figure 2C). Among NPM1-mutated patients (n=341), median OS was not reached (IQR, 11.4-NR) with IC+MIDO versus 8.6 months (IQR, 2.4-23.2) with IC (p<0.0001; Figure 2D).
A Cox proportional hazards model for OS (Table 3) showed that ECOG performance status ≥2 (aHR 1.36, 95% CI: 1.07-1.72, p=0.01), secondary AML (aHR 1.37, 95% CI: 1.08-1.75, p=0.01), baseline WBC count ≥30x10⁹/L (aHR 1.27, 95% CI: 1.03-1.56, p=0.028), and FLT3-ITD allelic ratio >0.5 (aHR 1.45, 95% CI: 1.15-1.83, p=0.002) were independently associated with shorter OS. Conversely, treatment with midostaurin (IC+MIDO) was independently associated with longer OS (aHR 0.46, 95% CI: 0.36-0.58, p<0.001).
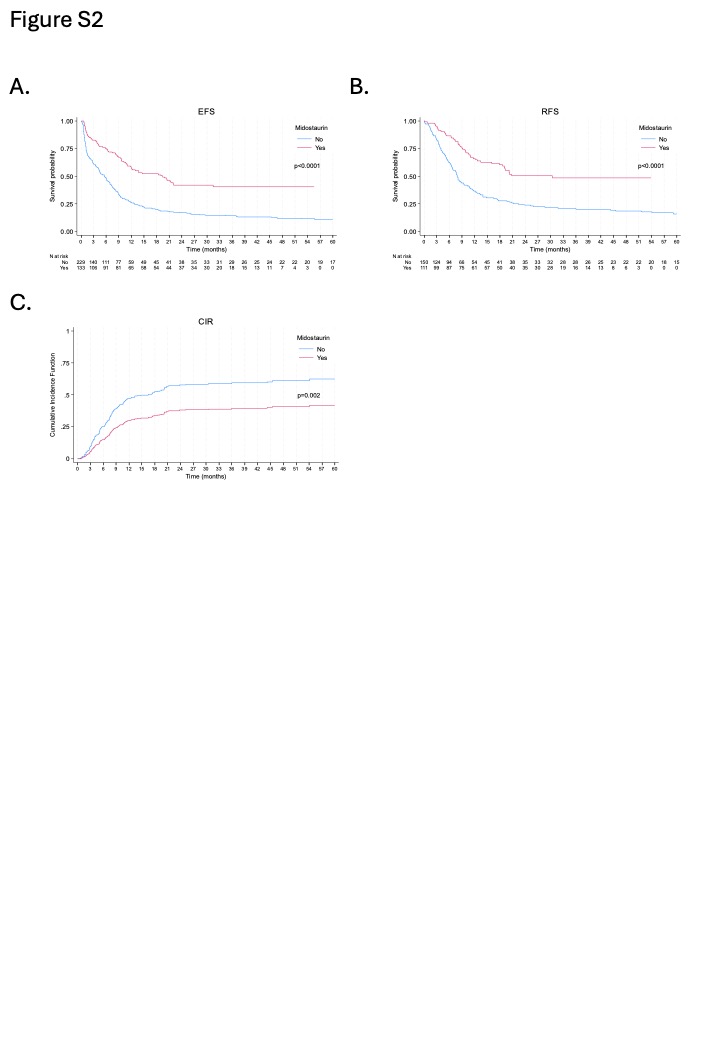
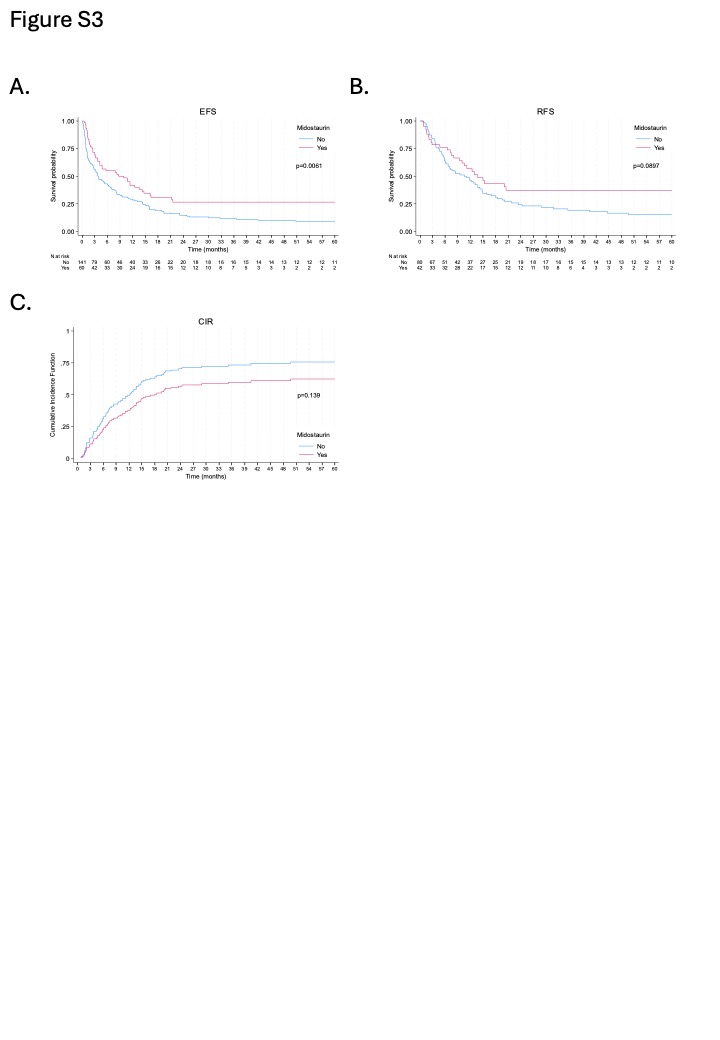
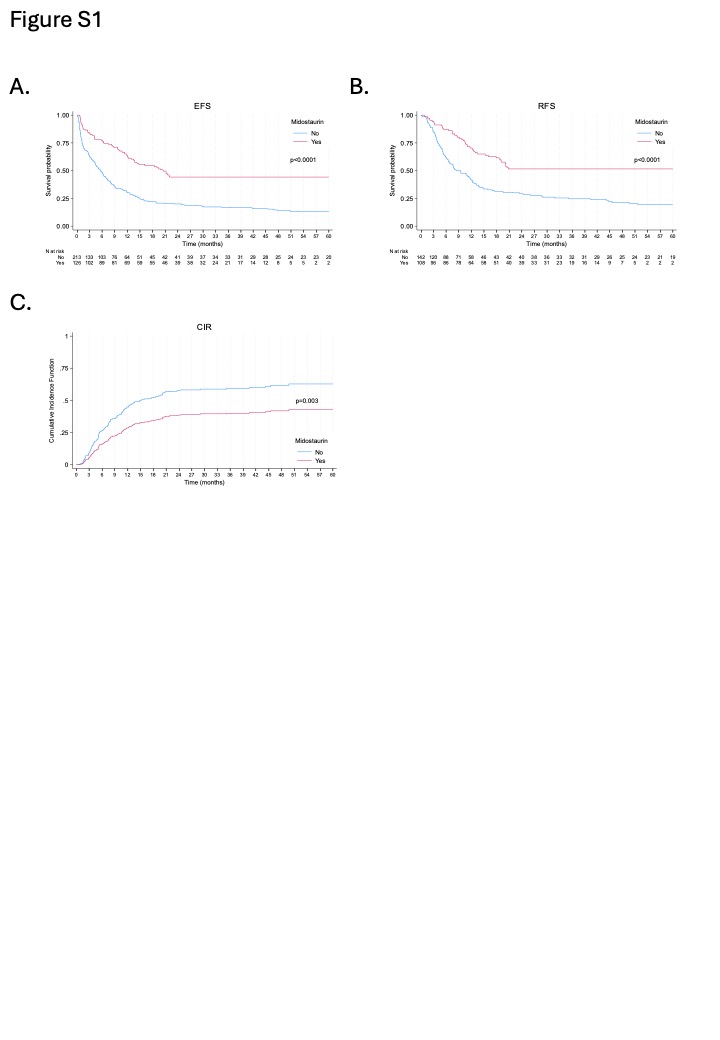
Event-free survival (EFS) was significantly longer with IC+MIDO (Figure 2E); median EFS was 13.5 months (IQR, 3.8-NR) versus 4.6 months (IQR, 1.1-13.8) with IC (p<0.0001). The 1-year, 3-year, and 5-year EFS rates for the IC+MIDO group were 52.5%, 36.0%, and 36.0%, respectively, compared to 27.0%, 13.2%, and 10.1% for the IC group. EFS outcomes for NPM1-mutated patients are presented in Supplementary Figure S1A. For patients <70 years and ≥70 years, EFS outcomes are shown in Supplementary Figure S2A and Figure S3A, respectively.
Relapse-free survival (RFS) was also significantly improved in the IC+MIDO group (Figure 2F), with a median RFS of 20.2 months (IQR, 8.4-NR) compared to 8.0 months (IQR, 3.9-22.4) for the IC group (p<0.0001). The 1-year, 3-year, and 5-year RFS rates for the IC+MIDO group were 63.4%, 45.4%, and 45.4%, respectively, compared to 40.0%, 20.4%, and 15.7% for the IC group. RFS outcomes for NPM1-mutated patients are presented in Supplementary Figure S1B. For patients <70 years and ≥70 years, RFS outcomes are shown in Supplementary Figure S2B and Figure S3B, respectively. Multivariate analyses for EFS and RFS (Table 3) indicated that midostaurin was significantly and independently associated with improved outcomes for both.
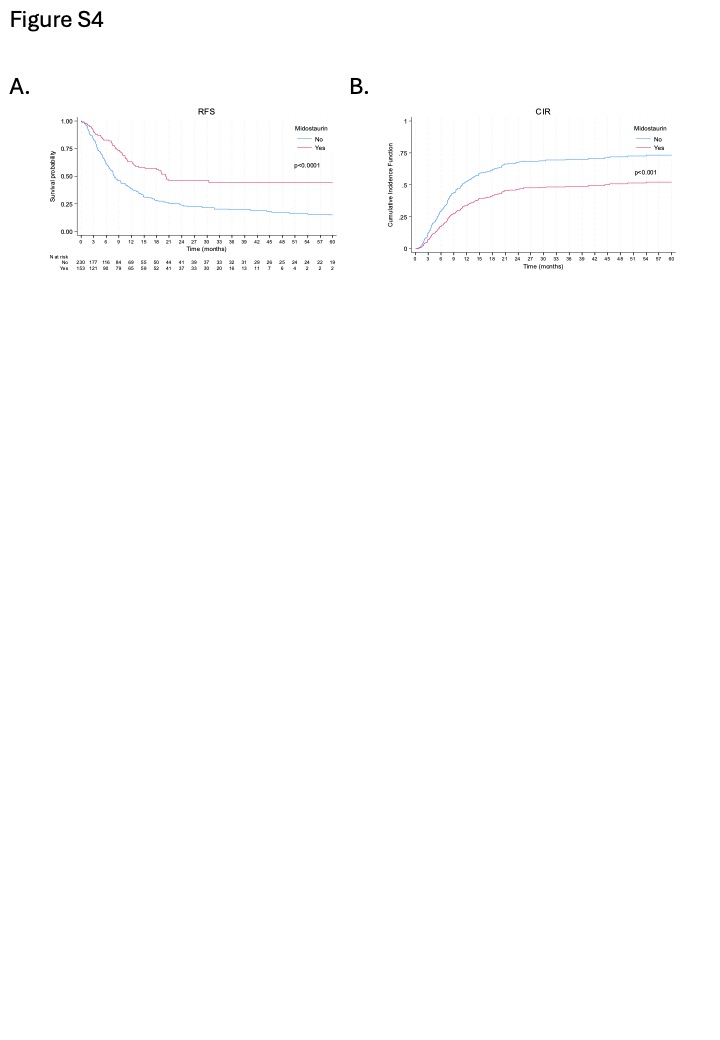
The cumulative incidence of relapse (CIR) was significantly lower in the IC+MIDO group compared to the IC group (p<0.001; Figure 2G). At 1 year, 3 years, and 5 years, CIR for the IC+MIDO group was 32.2%, 45.3%, and 47.8%, respectively, versus 48.5%, 64.4%, and 67.1% for the IC group. CIR for NPM1-mutated patients is presented in Supplementary Figure S1C. For patients <70 years and ≥70 years, CIR outcomes are shown in Supplementary Figure S2C and Figure S3C, respectively. Sensitivity analyses censoring patients at the time of allogeneic HSCT yielded similar results for RFS and CIR (Supplementary Figure 4).
Sensitivity Analysis Using Propensity Score Matching
To further account for potential baseline differences between the IC and IC+MIDO groups, a propensity score matching (PSM) analysis was performed. A multivariable logistic regression model was generated to estimate each patient's propensity score for receiving midostaurin. Covariates included in this model were age, sex, ECOG performance status, AML status, WBC count, cytogenetic risk, FLT3-ITD mutation, FLT3-ITD allelic ratio, FLT3-TKD mutation, NPM1 co-mutation, and FAB classification. The model's performance was assessed using the Hosmer-Lemeshow χ2 statistic (p=0.244) and the c-statistic (0.72, 95% CI: 0.68-0.77). Prior to matching, the mean propensity score was 0.361 (±0.190) in the IC group (N=260 with complete data for PSM) and 0.511 (±0.160) in the IC+MIDO group (N=192 with complete data for PSM). Using these scores, 118 patients receiving midostaurin were matched on a 1:1 basis with 118 patients not receiving midostaurin. In the matched sample of 236 patients, mean propensity scores were well balanced between the IC+MIDO group (0.465 ± 0.143) and the IC group (0.465 ± 0.144). Outcomes (CRc, OS, EFS, and RFS) were then compared between these matched groups.
In the propensity score-matched cohort (N=236), the CRc rate was significantly higher in the IC+MIDO group (79.7%, 94/118) compared to the IC group (60.2%, 71/118; p<0.001). Treatment with midostaurin in the matched cohort also resulted in significantly improved survival outcomes (Figure 3). Median OS was 24.2 months (IQR, 10.5-NR) for the IC+MIDO group versus 8.9 months (IQR, 1.9-19.7) for the IC group (p<0.0001). Median EFS was 13.8 months (IQR, 3.7-NR) for IC+MIDO versus 3.5 months (IQR, 1.0-10.4) for IC (p<0.0001). Similarly, median RFS was 20.1 months (IQR, 8.0-NR) for IC+MIDO compared to 8.0 months (IQR, 3.5-45.4) for IC (p=0.0019).