Aiming at the problems of low survival rate and unclear mechanism of stress treatment of Modified Jowett's spore A (MSJA) during drying. Firstly, response surface methodology was designed to optimize the stress treatment process of MSJA in order to improve the survival rate of spray drying. Then, with the help of high-resolution field emission scanning electron microscope (FESEM) observation, the effect strength and influence mechanism of each stress treatment process were explored. The results showed that the survival rate of MSJA could be increased from 38.5% to 54.8% under the typical conditions of heat shock temperature (X)=35.2 ℃, acid stress pH (Y)=3.2, and KH2PO4 concentration (Z)=4 g/L. From comprehensive treatment → heat shock → acid stress → salt stress, the protective effect decreased in turn. The reason is that the diameter, morphology and smoothness of cell wall of MSJA treated by the above stress decreased after spray drying.
Research Article
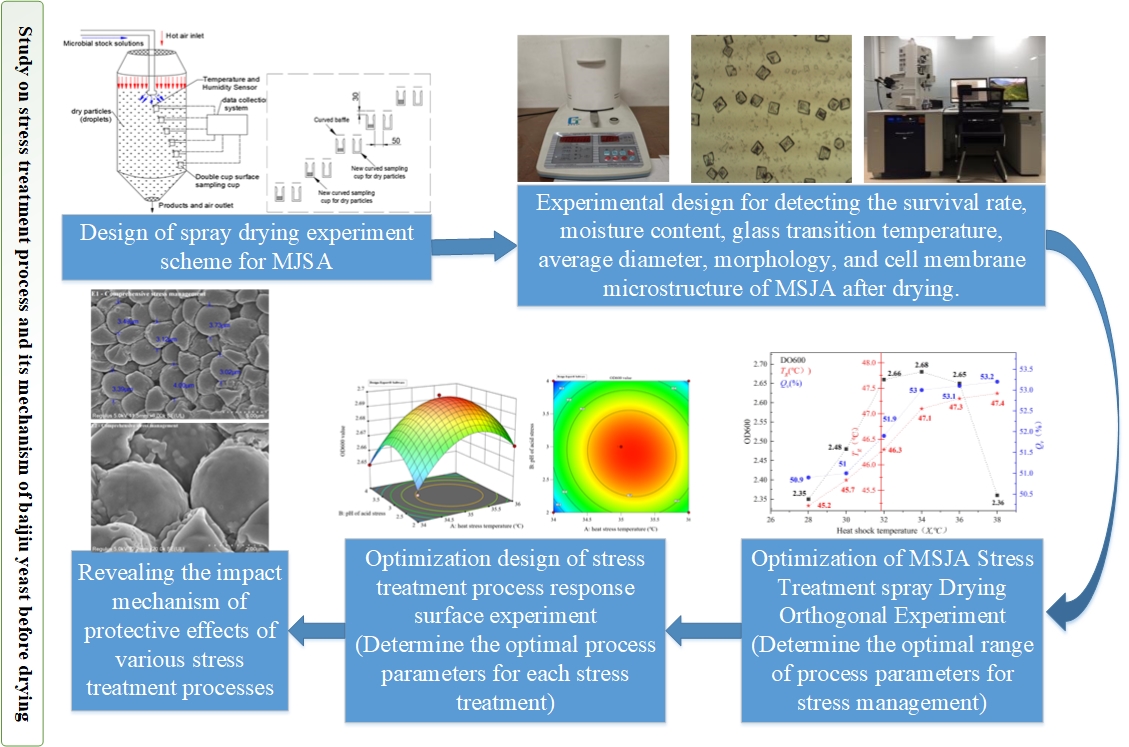
Study on stress treatment process and its mechanism of baijiu yeast before drying
https://doi.org/10.21203/rs.3.rs-6852813/v1
This work is licensed under a CC BY 4.0 License
Journal Publication
published 05 Nov, 2025
Read the published version in Bioresources and Bioprocessing →
You are reading this latest preprint version
Spray drying
Modified Jowett's spore A
Stress management
protection mechanism
As an important part of traditional Chinese culture, baijiu is an intangible cultural treasure of the Chinese nation, and the baijiu industry is one of the pillars of the national economy. However, the problem of storage and transport difficulties inherent in high-quality liquid active baijiu yeast has seriously constrained the high-quality development of the Chinese baijiu industry (Cheng, et al. 2022; Liu, et al. 2023; Ukić, et al. 2021.). It is generally agreed in current research that drying of high-quality baijiu yeast is the key to achieving its convenient transport, long-time storage and large-scale promotion of its use to promote the development of the baijiu industry (Engeland et al, 2018; Engeland, et al. 2022; Dürr, et al. 2020; Kang, et al. 2025.). Spray drying has been recognized as one of the most promising methods for drying high-quality baijiu yeasts due to its combination of high efficiency, automatic granulation and low cost, but the problem of low drying survival needs to be solved (Al Zaitone, et al. 2022; Cheng, et al. 2021). The stress treatment happened to be carried out during the cultivation process, which can not only improve the survival rate of spray drying, but also ensure the drying efficiency.
Stress treatment is a process in which microorganisms are placed in an adversity prior to drying and their innate defense mechanisms are exploited to produce protective components to improve their drying survival; it mainly consists of heat stress, acid stress, and salt stress. Zhen, et al. (2020) investigated the effect of heat stress on freeze-drying tolerance of Lactobacillus acidophilus ATCC4356 and its mechanism and showed that heat stress induced the opening up of the bacterium's defense mechanisms and caused. Yang, et al. (2023) investigated the effects of heat stress on the spray-drying survival and fermentation capacity of Lactobacillus acidophilus and showed that heat stress could improve the spray-drying survival and fermentation capacity. Lactobacillus lactis spray-drying showed that salt stress had less effect on its survival rate. Gao, et al. (2020) investigated the effects of five stresses, namely, salt, acid, cold, heat and starvation on the freeze-drying survival rate of Lactobacillus lactis, and showed that appropriate cross-stressing could greatly improve its survival rate. Although the above studies have analyzed the effects of different stress treatments on microbial drying survival; however, it is rare to find response surface optimization studies that include verification temperature (storage resistance) as an optimization objective, and consider microbial culture growth in conjunction with the demands of large-scale production in enterprises by combining the culture and stress treatments in tandem (Yuan, et al. 2022).
Therefore, in this paper, combined with the storage and large-scale production needs, the orthogonal experiment and response surface experiment were designed to optimize the process parameters of heat shock, acid stress and salt stress, aiming at the growth of MSJA culture (OD600), rehydration survival rate (Qv) and glass transition temperature (Tg). Then, the FESEM observation experiment was designed to directly observe the diameter, morphology and cell wall microstructure of MSJA after spray drying of each stress treatment, and the mechanism of different protective effects of each stress treatment process was condensed. Finally, the goal of high efficiency, high survival rate and large-scale continuous drying of MSJA was achieved, and the reference for stress treatment before microbial drying was provided.
2.1 Experimental materials and experimental scheme design of spray drying
2.1.1 Experimental Materials
In this study, the Pioneer LPG-5 spray dryer was selected for spray drying experiments, in which the main drying tower of the spray dryer had a height of h = 2 m, a cylinder height of h1 = 1.14 m, a diameter of D = 800 mm, in which the effective drying section had a height of h2 = 1 m, a bottom conical taper of a = 60°, and an outlet aperture of d = 89 mm. The material was atomized by means of a motorized centrifugal nozzle of the DLP-50 type, with a spray disc diameter of 50 mm, rated power of 0.55 KW, and rated speed of 25000 rpm (Xiong, et al. 2024).
The equipment used includes Ultraviolet-Visible Spectrophotometer (UV-Vis), Biological Optical Microscope (OM), Differential Scanning Calorimeter (DSC), Constant Temperature Shock Incubator, Moisture content tester, pH meter, Autoclave, Vertical Flow Ultra-clean Bench, Low Temperature High Speed Centrifuge, Ultra-low temperature freezer.
NYEPD medium was developed by our team in the previous study and was formulated as follows: sucrose molasses 51 g/L, beef paste 14 g/L, yeast paste 15 g/L, K2HPO4 1.3 g/L, VB1 0.01 g/L, VB2 0.01 g/L, and myo-inositol 0.01 g/L (Xiong, et al. 2024).
2.1.2 Spray drying experiment and detection process design
The MSJA spray drying experimental programmer is: cleaning → preheating → feeding → drying particles → 4 ℃ cold storage → testing and inspection; parameters: material flow rate of 700 mL/h, hot air flow rate of 70 m3/h, inlet hot air temperature of 120 ℃.
The OD600 and Tg were determined using UV-Vis and DSC, and Qv was determined with the help of OM using hematocrit (Xiong, et al. 2024).
2.2 Optimized design of the stress treatment process before drying
2.2.1 Orthogonal experiments
Combined with the optimization requirements of the culture process parameters, the experimental optimization scheme of the heat-excited process parameters was designed as follows:① The activated MSJA was inoculated in equal amounts into 15 NYEPD media, and incubated for 9 h at 180 r/min in a constant temperature and humidity incubator at 28, 30, 32, 34, 36 ℃ and 38 ℃, respectively, and the pH of the incubation solution was measured at intervals of 2 h, and was controlled to be pH 1 ~ 4 (Xiong, et al. 2024). ②All samples were removed after the completion of incubation and their OD600 was measured.③ The culture medium together with MSJA was directly spray-dried under typical processes to obtain MSJA dry powder particles and Qv and Tg were determined, respectively. ④OD600, Qv and Tg of the pellets were used as optimization targets and graphical analysis was carried out to determine the optimum temperature range for thermal.
Combined with the optimization requirements of the culture process parameters, the optimization scheme of the acid stress process parameters was designed as follows:① The activated MSJA was inoculated in equal quantities in 19 NYEPD media and cultured for 9 h at a temperature of 34 ℃ and a rotational speed of 180 r/min in a constant-temperature, humidity and shock incubator, and the pH was measured in the culture solution at 0.5 h intervals, and the pH of the control solution was set at 1, 2, 3, 4, 5 and 6. ② All samples were taken out after the completion of incubation and their OD600 was determined.③ The culture medium along with MSJA was directly spray dried under typical process to obtain MSJA dry powder particles and Qv and Tg were determined, respectively. ④OD600, Qv and Tg were used as optimization targets and graphical analysis was performed to determine the optimum pH range for heat excitation.
Salt stress is different from acid stress and thermal stress in that the type of added inorganic salts must also be experimentally optimized before experimental optimization of the amount of added inorganic salts; therefore, in this study, OD600 was used as an evaluation index to design experiments for the preliminary optimization of the type and amount of added inorganic salts. The experimental protocol was as follows:① After removing the inorganic salt component from the NYEPD medium, five kinds of inorganic salts, namely, KH2PO4, CaCl2, MgSO4, ZnSO4, and NaCl, were added, and the amount of each kind of inorganic salt was put into the medium was 2, 3, 4, 5 g/L, and 6 g/L, respectively.② In the constant-temperature water-bath shaker incubator at the temperature of 34 ℃, the humidity of 70%, and the rotation speed of 180 r/min, the inorganic salt was added into the medium, and the amount of each kind of inorganic salt was added into the medium. The incubation was carried out at 34 ℃, 70% humidity and 180 r/min speed for 9 h.③ The OD600 was measured and analyzed to find out the most suitable inorganic salt species.
The protocol of the optimization experiment for the parameters of homoeopathic salt stress was as follows: ① The activated MSJA was inoculated in equal quantities into 15 NYEPD media. ② The inorganic salts determined above were added to the 15 media at the addition concentrations of 3, 3.5, 4, 4.5 g/L and 5 g/L, respectively.③ Cultured in a constant temperature and humidity-shaking incubator at a temperature of 34 ℃ and a rotational speed of 180 r/min for 9 h. The pH of the culture solution was measured at intervals of 2 h, and controlled to be 2 ~ 4. ④ All the samples were taken out after the completion of the culture, and the OD600 was measured.⑤ The culture medium was directly spray-dried together with the MSJA under the typical process, and the dry powder particles of the MSJA were obtained, and Qv and Tg were determined, respectively.). (vi) Graphical analysis was carried out using OD600, Qv and Tg as optimization objectives to determine the optimum concentration range for the addition of inorganic salts.
2.2.2 Response surface experiments
In the above orthogonal experiments, although the optimum range of process parameters was obtained for heat excitation, salt stress and acid stress, respectively, they were not optimized to obtain the optimum values for the three processes. Therefore, in this section, within the optimal range of the above three process parameters, OD600, Qv and Tg were again used as the optimization objectives. Moreover, the temperature of heat stress (X), pH of acid stress (Y) and concentration of salt added (Z) were used as the variables, and a one-way experimental scheme was designed using the Box-Behnken Design model in Design Expert, the results obtained are shown in Table 1. Three replicate experiments were conducted according to the one-factor experimental protocol, and after taking the average values and filling in the Box-Behnken Design module as required. In addition, after significance analysis, the significance results obtained for the effects of X, Y and Z on OD600, Qv and Tg are shown in Table 2.
| Serial number | X | Y | Z | OD600 | Qv(%) | Tg(°C) |
|---|---|---|---|---|---|---|
| 1 | 36 | 4 | 4 | 2.66 | 53.5 | 47.2 |
| 2 | 35 | 3 | 4 | 2.7 | 53.9 | 47.4 |
| 3 | 35 | 3 | 4 | 2.7 | 53.9 | 47.4 |
| 4 | 34 | 3 | 3.5 | 2.67 | 53.6 | 47.2 |
| 5 | 35 | 2 | 4.5 | 2.68 | 53.7 | 47.3 |
| 6 | 36 | 3 | 4.5 | 2.68 | 53.7 | 47.3 |
| 7 | 35 | 3 | 4 | 2.7 | 53.9 | 47.4 |
| 8 | 34 | 4 | 4 | 2.65 | 53.4 | 47.1 |
| 9 | 35 | 3 | 4 | 2.7 | 53.9 | 47.4 |
| 10 | 35 | 2 | 3.5 | 2.68 | 53.7 | 47.3 |
| 11 | 36 | 2 | 4 | 2.67 | 53.6 | 47.2 |
| 12 | 36 | 3 | 3.5 | 2.68 | 53.7 | 47.3 |
| 13 | 35 | 4 | 3.5 | 2.67 | 53.6 | 47.2 |
| 14 | 34 | 3 | 4.5 | 2.67 | 53.6 | 47.2 |
| 15 | 34 | 2 | 4 | 2.65 | 53.4 | 47.1 |
| 16 | 35 | 4 | 4.5 | 2.67 | 53.6 | 47.2 |
| 17 | 35 | 3 | 4 | 2.69 | 53.8 | 47.3 |
| Optimization goals | X (℃ ) | Y | Z (g/L) |
|---|---|---|---|
| OD600 | 0.0026 | 0.0290 | 1 |
| Qv (%) | 0.0028 | 0.0281 | 1 |
| Tg (℃ ) | 0.0135 | 0.0148 | 1 |
Observation of Table 1 shows that when the optimization objective is OD600, PX=0.0026 < 0.01, PY=0.0290 < 0.05, PZ=1>0.1; and when the optimization objective is drying survival of MSJA, PX=0.0028 < 0.01, PY=0.0281 < 0.05, PZ=1>0.1. Moreover, when the optimization objective was Tg, PX=0.0135 < 0.05, PY=0.0148 < 0.05, PZ=1>0.1. It can be concluded that the effects of changes in both the X and Y variables were significant on OD600, Qv and Tg, whereas the effects of Z on OD600, Qv and Tg are insignificant. Therefore, in this section, it is proposed to use the preferred Z = 4 g/L calculated by Design Expert as the default value and to perform the diagnostic evaluation of the two parameters, X and Y, targeting OD600, Qv and Tg. The results are shown in Fig. 1.
Observing Fig. 1A it is easy to find that the experimentally determined values (colored squares) are compactly distributed around the model predicted values (diagonal line), which indicates that the model predicted values and experimentally determined values obey a normal distribution, and verifies the independence and normality of the residuals. B is easy to find that the determined values (colored squares) are clustered along the predicted values (line) and uniformly distributed on the two sides, which indicates that the quadratic regression model is well fit to the response surface of experimentally obtained data. The response surface of the data is well fitted. C is not difficult to find that the predicted values (colored squares) are distributed around the 0-axis and none of them exceed the limit value (red line), indicating that the predictive accuracy of the model meets the requirements. D is not difficult to find that the values obtained from the model's predictions are randomly and uniformly distributed near the 0-axis and do not show any obvious regularities or anomalies. It proves that the model is effective and meets, the requirements for optimization of the three stress parameters X, acid stress Y and Z. Once the validity of the model was demonstrated through diagnostic evaluation, it was then possible to optimize the response surface analysis of X and Y using Box-Behnken Design with OD600, Qv and Tg as the objectives. and the experimental data shown in Table 1.
2.3 Experimental design of MSJA cell morphology observation
In order to reveal the mechanism of different stress treatments to improve the survival rate of MSJA spray drying, the diameter, morphology and cell wall state of MSJA were directly observed by FESEM. The specific observation and test scheme is as follows: ① directly fix the dry particle sample on the specific sample table with conductive double-sided tape. ② Spray gold treatment. ③ The diameter, morphology and cell wall microstructure of MSJA were observed directly in the sample chamber of FESEM.
3.1 Analysis of orthogonal experiment
The experiment was carried out according to the orthogonal experimental scheme and the obtained experimental data were plotted and analyzed using Origin, and the resulting effects of X, Y and Z on OD600, Qv and Tg are shown in Fig. 2, respectively.
As shown in Fig. 2A, the OD600 value showed an extremely rapid increase in the interval of 28 ~ 32 ℃,and then it levelled off in the interval of 32 ~ 36 ℃ and reached the peak (2.68) at 34 ℃, finally it dropped from 2.65 to 2.36 after 36 ℃; therefore, from the point of view of OD600. So it can be obtained that 32 ~ 36 ℃ is the optimal incubation temperature. Qv showed an increasing trend with the increase of temperature at first, and reached 53% at the temperature of 34 ℃, and then it gradually became a steady state of slow increase. Therefore, from the point of view of Qv (drying protection effect) it can be obtained that: the temperature of 34 ℃ was the best incubation temperature band. Qv≥ at first shows a rising trend with the rise of temperature, and reaches 53% at 34 ℃, and then gradually processes a slow rise in the steady state. Therefore, from the perspective of Qv, it can be obtained that: the temperature 34 ℃ is the optimal protection temperature section. The temperature was greater than 36 ℃, although the high temperature heat stress further stimulated the MSJA stress system to produce more heat shock proteins in order to increase Qv; however, it also hindered the division of MSJA, and reduced the OD600. The trend of Tg was similar to the trend of Qv, so from the storage point of view, we can get the following: the temperature of ≥ 34 ℃ is the optimal storage temperature section. In summary, this experiment initially concluded that the optimal thermal excitation temperature band for MSJA is 34 ~ 36 ℃.
As shown in Fig. 2B, firstly, the observation of OD600 change can be obtained: pH = 1 ~ 2 showed an increasing trend, pH = 2 ~ 5 was stable between 2.67 ~ 2.69, and began to decline after pH > 5, so the most suitable pH for MSJA culture is = 2 ~ 5. Then, the observation of Tg change can be obtained: before pH < 4 Tg was stable between 47 ~ 47.2 ℃, and after pH > 4, Tg began to decrease continuously, so the most suitable pH for MSJA storage was considered to be 1 ~ 4. Finally, the analysis of Qv showed that: it was stable between 52.7% and 53.3% at pH 1 ~ 4, and began to decrease after pH > 4, so the most suitable pH for MSJA drying was considered to be 1 ~ 4. In summary, the present experiment tentatively concluded that the optimal acid stress for MSJA pH = 2 ~ 4 was concluded.
As shown in Fig. 2C, OD600, except for the direct decrease with the increasing concentration of MgSO4 from 0, showed an increasing and then decreasing pattern with the increasing concentration of the rest of the inorganic salts from 0, and there was an inflection point from increasing to decreasing at 3 g/L or 4 g/L (maximum point). When KH2PO4 was added to the medium at a concentration of 3 g/L, the OD600 reached the maximum value of 2.71 for all the additive solutions, and the OD600 was stabilized at a concentration of 3 ~ 5 g/L, which was greater than that of all other additive solutions, between 2.68 ~ 2.71, but it declined rapidly after the addition of the concentration of > 5 g/L. Therefore, this experiment tentatively concluded that KH2PO4 is the preferred added salt and the most suitable KH2PO4 concentration for MSJA growth is 3 ~ 5 g/L.
As shown in Fig. 2D, the OD600 was stabilized in the high range of 2.67–2.71 from the beginning because the concentration of KH2PO4 was optimized with OD600 as the optimization target during the selection of the additive type, and the trend of Tg was similar to that of OD600, which was also stabilized in the high range of 47.2–47.5 ℃ from the beginning. interval. Therefore, from the perspective of cultivation and storage, it was concluded that the applicable range of KH2PO4 addition concentration was 3 ~ 5 g/L. Qv increased rapidly from 51.9–53.4% in the range of KH2PO(4) addition concentration from 3 g/L to 3.5 g/L, and from 53.9–53.4% in the range of KH2PO4 concentration from 3.5 g/L to 4.5 g/L. The interval range of KH2PO4 addition concentration from 3.5 g/L to 4.5 g/L showed a steady state from 53.4–53.9% with a slow increase, and then a very rapid decrease to 52.4% at 5 g/L after the KH2PO4 addition concentration was greater than 4.5 g/L. Therefore, from the point of view of Qv, it can be obtained that the optimum interval of KH2PO4 addition concentration is 3.5 ~ 4.5 g/L. In summary, the experiment has reached the preliminary conclusion that the optimum interval of KH2PO4 addition concentration is 3.5 ~ 4.5 g/L.
3.2 Analysis of response surface experiment
The experiments were carried out according to the response surface experimental programmer and the results obtained are shown in Fig. 3 respectively.
Observing Fig. 3 it is easy to conclude that the positions labelled with reddish-brown dots in the graphs best balance OD600, Qv and Tg to simultaneously accommodate high quality cultivation, high viability spray drying and high quality storage of MSJA. The optimization equations for OD600, Qv and Tg were obtained by response surface analysis as shown in Eq. 1 below, respectively.

Calculations were performed according to Eq. 1 to obtain the optimum heat stress temperature (X), acid stress pH (Y) and KH2PO4 addition concentration (Z). The optimal values for each parameter for cultivation (OD600) are: X = 35.18 ℃, Y = 3.18 and Z = 4. The optimal values for each parameter for dry survival rate (Qv) are: X = 35.19 ℃, Y = 3.19 and Z = 4. The optimal values for each parameter for storage resistance (Tg) are: X = 35.18 ℃, Y = 3.19 and Z = 4.
The optimal thermal stress temperature (X), acid stress pH (Y) and KH2PO4 addition concentration (Z) obtained after optimization with OD600, Qv and Tg as the objectives were 35.2 ℃, 3.2 and 4 g/L, respectively, after retaining one decimal (because the effective range of the thermometer and the pH meter is one decimal place); therefore, after optimization through the analysis of the response surface experiments. The optimal stress treatment process parameters for MSJA spray drying determined in this study were: thermal stress temperature (X) = 35.2 ℃, acid stress pH (Y) = 3.2, and concentration of KH2PO4 added for salt stress (Z) = 4 g/L.
The spray drying test of MSJA after each stress treatment under the optimal parameters showed that the survival rates of MSJA under heat shock + acid stress + salt stress (hereinafter referred to as comprehensive stress treatment), heat shock, acid stress and salt stress were 54.8%, 46.7%, 49.7% and 43.6%, respectively. Compared with MSJA without stress treatment, the survival rate of spray drying was improved by 38.5%.
3.3 FESEM observation and experimental analysis
FESEM was used to observe the diameter, morphology and cell wall microstructure of MSJA cells after spray drying without treatment, heat shock, acid stress, salt stress and comprehensive stress treatment, as shown in Fig. 4.
Compared with A to E in Fig. 4, the change rule of MSJA is as follows: in the order of comprehensive stress treatment → heat shock → acid stress → salt stress → no treatment, the average diameter and morphological consistency of MSJA gradually decrease, while the perforation, folding and collapse of cell wall gradually increase. This change rule is consistent with the change rule of MSJA survival rate after drying in the previous section, which shows that the diameter, shape and smooth integrity of cell wall of MSJA after stress treatment are the key factors affecting the protective effect of stress treatment process.
This study fully considered the needs of large-scale production of enterprises, organically combined stress treatment and cultivation, and designed orthogonal experiment and response surface experiment in turn. Taking into account the survival rate and storage of MSJA after culture, drying, and taking OD600, Qv, and Tg as the objectives, the heat shock temperature, acid stress pH, and salt concentration were optimized. The results show that:
(1) The results showed that the survival rate of MSJA could be increased from 38.5–54.8% under the typical conditions of heat shock temperature (X) = 35.2 ℃, acid stress pH (Y) = 3.2, and KH2PO4 concentration (Z) = 4 g/L.
(2) Under the optimal process parameters, MSJA was treated in the order of comprehensive stress treatment → heat shock → acid stress → salt stress → no treatment. After spray drying, the survival rate of MSJA gradually decreased, and the average diameter, morphological consistency and smooth integrity of cell wall gradually decreased. The results showed that the average diameter, morphological consistency and smooth integrity of cell wall of MSJA were the key factors affecting its protective effect after different stress treatments.
Ethics approval and consent to participate
Not applicable.
Consent for publication
All authors agree to publish this manuscript in "Bioresources and Bioprocessing".
Competing Interest
The authors declare that they have no competing interests.
Funding
This work was supported by the State Key Laboratory of Bioreactor Engineering [KN-SKLB-BIOB-1221]. Sichuan University of science & engineering talent introduction project [2025RCZ066]. Sichuan University of Science & Engineering Innovation Team [SUSE652A010].
Author's Contribution
"Fengkui Xiong was responsible for the design of the experiment and the writing of the full text. Guangzhong Hu is responsible for the structure design and experimental guidance of the full text. Zhongbin Liu is responsible for data collection, collation and mapping. Duqing Qu is in charge of language polishing. Jingyu Li is responsible for data collection and analysis. Bo Huang is responsible for funding and experimental material support and full text revision review." All authors reviewed the manuscript.
Acknowledgement
Not applicable..
Availability of Data and Materials
All data generated or analyzed during this study are included in this published article.
- Al Zaitone, B., Al-Zahrani, A., Ahmed, O., et al. (2022). Spray drying of PEG6000 suspension: Reaction Engineering Approach (REA) modeling of single droplet drying kinetics. Processes, 10, 1365. https://doi.org/10.3390/pr10071365
- Cheng, S. S., Su, W. T., Yuan, L., et al. (2021). Recent developments of drying techniques for aquatic products: With emphasis on drying process monitoring with innovative methods. Drying Technology, 39(11), 1577–1594. https://doi.org/10.1080/07373937.2021.1895205
- Cheng, W., Chen, X. F., Zhou, D., et al. (2022). Applications and prospects of the automation of compound flavor baijiu production by solid-state fermentation. International Journal of Food Engineering, 18(12), 737–749. https://doi.org/10.1515/ijfe-2022-0200
- Cnossen, D. C., Rodrigues, R. C., Martins, E., et al. (2020). The influence of adaptive stresses on the survival of spray-dried Lactococcus lactis cells. Journal of Dairy Research, 87(3), 382–385. https://doi.org/10.1017/S0022029920000758
- Dürr, R., & Bück, A. (2020). Influence of moisture control on activity in continuous fluidized bed drying of baker's yeast pellets. Drying Technology, 40(3), 678–683. https://doi.org/10.1080/07373937.2020.1828449
- Engeland, C. V., Spreutels, L., Legros, R., et al. (2018). Convective drying of baker's yeast pellets containing a carrier. Drying Technology, 37(11), 1–13. https://doi.org/10.1080/07373937.2018.1504060
- Engeland, C. V., Aujard, M., Rabineau, J., et al. (2022). Evolution of the quality of baker's yeast pellets containing a carrier during their convective drying. Drying Technology, 40(11), 15. https://doi.org/10.1080/07373937.2021.1944181
- Gao, X. W., Kong, J., Zhu, H. K., et al. (2022). Lactobacillus, Bifidobacterium and Lactococcus response to environmental stress: Mechanisms and application of cross-protection to improve resistance against freeze-drying. Journal of Applied Microbiology, 132(2), 802–821. https://doi.org/10.1111/jam.15251
- Kang, H. J., Yu, H. H., Cho, C. W., et al. (2025). Optimization of medium composition and fluidized bed drying conditions for efficient production of dry yeast. Microorganisms, 13(1). https://doi.org/10.3390/microorganisms13010022
- Liu, Z., Xu, L., Wang, J., et al. (2023). Research progress of protein haze in baijius. Food Science and Human Wellness, 12(5), 1427–1438. https://doi.org/10.1016/j.fshw.2023.02.004
- Ukić, N., Radonjić, A., Popović, B., et al. (2021). Development and progeny performance of Tribolium castaneum (Herbst) in brewer's yeast and wheat (patent) flour at different population densities. Journal of Stored Products Research, 94, 101886. https://doi.org/10.1016/j.jspr.2021.101886
- Xiong, F. K., Li, J. Y., Yuan, Y. J., et al. (2024). Investigating the spray drying damage mechanism of baijiu yeast with combined drying process and equipment. International Journal of Food Engineering, 20(6), 389–403. https://doi.org/10.1515/ijfe-2023-0301
- Xiong, F. K., Yuan, Y. J., Kang, L., et al. (2024). CFD modeling of baijiu yeast spray drying process and improved design of drying tower. Drying Technology, 42(5), 836–853. https://doi.org/10.1080/07373937.2024.2319321
- Yang, H., Huang, P., Hao, L., et al. (2023). Enhancing viability of dried lactic acid bacteria prepared by freeze drying and spray drying via heat preadaptation. Food Microbiology, 112, 104239. https://doi.org/10.1016/j.fm.2023.104239
- Yuan, Y. J., Xiong, F. K., Li, J. Y., Xu, Y. Y., & Zhao, X. T. (2022). Review on drying technology and damage protection mechanism of Baijiu yeast. *INMATEH - Agricultural Engineering, 68*, 735–746. https://doi.org/10.35633/inmateh-68-73
- Zhen, N., Zeng, X., Wang, H., et al. (2020). Effects of heat shock treatment on the survival rate of Lactobacillus acidophilus after freeze-drying. Food Research International, 136, 109507. https://doi.org/10.1016/j.foodres.2020.109507