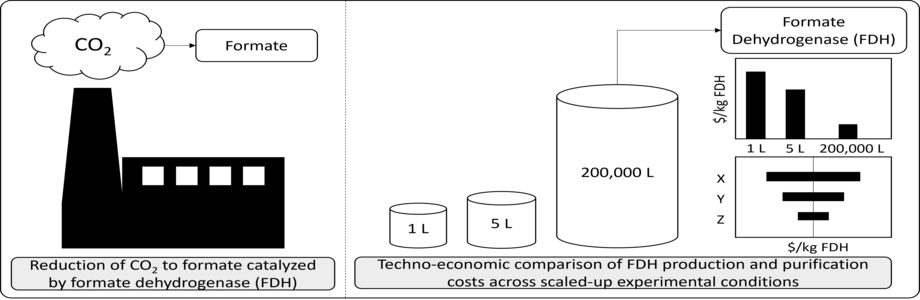
The conversion of carbon dioxide (CO2) into formate offers a promising route to enable a circular, carbon-smart bioeconomy. Formate is increasingly recognized as a versatile and energy-dense platform molecule that can serve as a feedstock for microbial fermentation, energy storage, and sustainable chemical and fuel production. A key bottleneck in this value chain is the availability of cost-effective and scalable formate dehydrogenase (FDH) enzymes, which catalyze the initial reduction of CO2 to formate. However, little is known about the economic feasibility of producing and purifying FDH at industrial scale. In this study, we developed data-driven techno-economic models to assess the production cost of FDH enzymes in M. extorquens using lab-scale data and projected outcomes across four scenarios: 1 L empirical, 5 L empirical, base, and optimistic. Our results show that the minimum selling price when using FDH as a crude protein preparation ranged from $2,300/kg (1 L empirical) to $75/kg (optimistic), while the use of purified FDH resulted in costs ranging from $99,000/kg to $970/kg, respectively. Sensitivity analyses revealed that protein purity has the greatest influence on final production cost, with substrate and electricity costs also contributing significantly in the two empirical scenarios. These findings provide insight into cost bottlenecks and help identify engineering targets for scaling FDH enzyme production, supporting the development of CO2-to-formate technologies and the broader formate-based bioeconomy.
Research Article
Techno-Economic Analysis of Industrial-Scale Fermentation for Formate Dehydrogenase (FDH) Production
https://doi.org/10.21203/rs.3.rs-7367233/v1
This work is licensed under a CC BY 4.0 License
Journal Publication
published 06 Dec, 2025
Read the published version in Bioresources and Bioprocessing →
You are reading this latest preprint version
Formate dehydrogenase
Enzyme production
Industrial biotechnology
Techno-economic analysis
Enzyme catalysis
Carbon dioxide utilization
C1 bioeconomy
To meet the United States’ net-zero emissions goal by 2050, technologies that reduce greenhouse gas (GHG) emissions, particularly carbon dioxide (CO2), are essential. One promising approach involves enzymatically converting CO2 into value-added chemicals and fuels using redox enzymes—biocatalysts that facilitate electron transfer reactions to transform CO2 into useful products (Bierbaumer et al., 2023; Iliuta and Larachi, 2023). Techno-economic analyses (TEAs) help identify cost- and energy-intensive steps in these pathways. While small-scale experimental data improve TEA accuracy, there remains a key gap in understanding the industrial-scale production costs of redox enzymes (Klein-Marcuschamer et al., 2012).
Redox enzymes, as oxidoreductases, catalyze reactions central to respiration and photosynthesis and are increasingly relevant in engineered carbon conversion systems (Léger and Bertrand, 2008). A leading candidate is formate hydrogenase (FDH), which catalyzes the reversible conversion between formate and CO2. In nature, FDH supports microbial respiration by oxidizing formate to CO2 and releasing reducing equivalents (Calzadiaz-Ramirez and Meyer, 2022). While the reverse reaction—reducing CO2 reduction to formate—is less favorable in natural systems, it becomes viable under engineered anaerobic conditions, enabling carbon capture and conversion into soluble, energy-dense compounds like formate or formic acid.
FDH catalyzes HCOO− ↔ CO2 + H+ + 2e− and the reverse (CO2 + H+ + 2e− ↔ HCOO−), using cofactors such as nicotinamide adenine dinucleotide (NAD+) or nicotinamide adenine dinucleotide phosphate (NADP+) for oxidation and NADH or NADPH for reduction. However, its oxygen sensitivity limits FDH activity and stability during both production and application (Cha et al., 2023; Fasano et al., 2024), presenting a significant barrier to industrial deployment.
Recent advances in genetic engineering have enabled heterologous expression of FDH in microbial hosts. For instance, expression in Picochlorum renovo enabled formate-based growth (Dahlin et al., 2023), and structural studies of recombinant FDH from Methylorubrum extorquens (formerly Methylobacterium extorquens) have revealed active-site features that support enzyme optimization (Park et al., 2024). Despite such progress, the scalability and cost of FDH production at industrial levels remain largely unexplored.
Enzyme production strategies vary with application, particularly with regard to purity. Pharmaceutical enzymes require high purity at low volumes, while industrial enzymes for food, textiles, and biofuels are produced in bulk at lower purities (Headon and Walsh, 1994). However, rising use of immobilized enzymes is increasing purity demands, as impurities can reduce catalytic stability, binding efficiency, and overall performance (Cao, 2005).
Enzyme production generally includes follows four stages: synthesis, recovery, purification, and formulation. In synthesis, microbial cells are cultivated—usually via fermentation—to produce intracellular or extracellular enzymes (Illanes, 2008). Genetic engineering can optimize secretion pathways to enhance yields (Becerra et al., 1997). Recovery methods depend on enzyme location: extracellular enzymes are recovered via centrifugation or filtration, while intracellular enzymes require cell disruption (e.g., sonication, homogenization, or lysis) followed by solid-liquid separation (Illanes, 2008).
Purification removes contaminants that may impair performance, especially in pharmaceutical or immobilized applications (Remans et al., 2022). While it improves specific activity, purification reduces yield, creating a trade-off between cost and product quality (Baumann and Hubbuch, 2017; Che Hussian and Leong, 2024). Common purification techniques include size exclusion, ion exchange, hydrophobic interaction, and affinity chromatography (Illanes, 2008). The final formulation stage stabilizes and standardizes enzymes for consistent use, ensuring batch-to-batch reliability, meeting regulatory requirements, and tailoring performance to application-specific needs (Illanes, 2008).
Although redox enzyme TEAs are limited, a few studies provide cost benchmarks. Walwyn et al. (2015) estimated the cost of producing horseradish peroxidase at ~$1,280/g ($1.28 million/kg) at a small-scale capacity of 5 kg/year. Market prices corroborated these figures at $1,250/g ($1.25 million/kg), emphasizing the high cost of redox enzymes at limited production scales. However, enzyme production costs generally decline with scale (Elsner et al., 2015), reinforcing the need for TEAs that reflect industrial capacities. In contrast, hydrolases, such as β-glucosidase, have been extensively studied due to their low cost and operational robustness. Ferreira et al. (2018) estimated β-glucosidase production at $316/kg for a large-scale operation producing 88,000 kg annually. This stark difference highlights the need for innovation and optimization in redox enzyme manufacturing to make them economically competitive.
Commercially available FDH remains costly and exhibits modest activity. For example, FDH from Candida boidinii (5–15 U/mg) is sold at $1,670 per 500 units, whereas laccase—another redox enzyme—costs $199 per 10,000 units (~ 50 U/mg) (Millipore Sigma, 2025a; Millipore Sigma, 2025b). In this study, FDH from Methylorubrum extorquens was produced in 1 L and 5 L lab-scale fermenters, achieving specific activities of 4.8–38.7 U/mg.
Despite rising interest in enzymatic CO2 conversion, limited empirical data exist for TEAs of redox enzyme manufacturing. This study incorporates laboratory-scale FDH production data into a TEA, offering grounded cost projections and identifying process bottlenecks. These insights provide a foundation for improving the economic viability and scalability of FDH-based CO2 utilization technologies.
2.1 Modeling and Simulation Software
We used SuperPro Designer v13 (Intelligen, USA) to model and simulate the process, which contained four main sections: media preparation, fermentation, downstream, and purification, as shown in Fig. 1. Additionally, we established data-driven stoichiometric reactions for the fermentation and parts of the downstream processes to determine the amounts of both reactants and products utilized and produced, respectively. We used Microsoft Excel to assess the economic feasibility of the process, taking into account the various capital and operating costs.
2.2 Process and Parameters
For the laboratory experiments, the alpha and beta subunits of the formate dehydrogenase enzyme MeFdh1 from Methylorubrum extorquens AM1 were cloned into an expression vector to enable recombinant protein production. A 6x histidine tag was fused to the C-terminus of the alpha subunit to facilitate protein purification. The plasmid backbone, pCM157 (Plasmid #45863), was obtained from Addgene. The IPTG-inducible promoter PL/O4, a strong promoter used for M. extorquens, was incorporated to control gene expression. Gibson assembly was used to seamlessly combine the promoter, MeFdh1 subunit genes, and plasmid backbone into the final recombinant plasmid. The plasmid was introduced into M. extorquens AM1 via electroporation to construct a recombinant strain. Electro-competent cells were prepared by growing M. extorquens AM1 to exponential phase (OD600 0.6–0.8), chilling the culture, and washing the cells with ice-cold sterile distilled water and 10% glycerol. The cells were then suspended in 10% glycerol and mixed with 2 µl of plasmid DNA in a chilled cuvette. Electroporation was performed using a Gene Pulser (Bio-Rad) with settings of 2.50 kV, 400 Ω, and 25 µF for a 2-mm gap cuvette. Post-electroporation, Nutrient Broth was added, and the cells were incubated at 30°C for 12 hours with 200 rpm shaking. Transformants were selected on succinate agar plates containing appropriate antibiotic (kanamycin), with colonies appearing after approximately 3 days (Carrillo et al., 2019).
We prepared inocula from a single colony in media containing succinate or methanol, allowing them to grow overnight until the optical density (OD) exceeded 0.7. We then induced protein expression using isopropyl β-D-thiogalactopyranoside (IPTG). After induction, we carried out the fermentation at 30°C, pH 7.0, and 180 rpm in a New Brunswick Bioflo fermenter (New Brunswick Scientific, Edison, NJ, USA) with a total volume of 2.3 L and a working volume of 1 L. We recorded various parameters, such as biomass cell density and total target protein, to incorporate into our TEA.
In our data-driven models, the annual enzyme production rate was 80 tonnes of enzyme/year on a dry basis for the purified enzyme cases. The media preparation section included nitrogen (ammonium), carbon (methanol), and medium (salts) sources, each linked to a 10 L shake flask, three seed fermentors with capacities of 100 L, 1,000 L, and 10,000 L, and a 200,000 L production-scale fed-batch fermentor. Since Methylorubrum extorquens is a strictly aerobic bacterium, we injected compressed air into each fermentor to maintain an aerobic environment (Peyraud et al., 2011). Following the production fermentor stage was the product recovery or downstream section that included a homogenizer, centrifuge, and dead-end filter (Ferreira et al., 2018). The soluble protein underwent two purification steps, while we considered the insoluble protein a solid byproduct that could be sold for revenue. After purification via diafiltration and immobilized metal affinity chromatography (IMAC), we produced a pure stream of FDH. Figure 1 presents the process flow diagram with mass flows for the base case. We also simulated the production of crude protein to evaluate the associated protein costs, where the process for these scenarios excluded both diafiltration and IMAC unit operations.
In this study, the SuperPro models that reflected the laboratory-scale data from the 1 L and 5 L fermentation vessels were considered as the empirical cases. From the 1 L laboratory-scale experiments, the biomass cell density was 4.2 g/L coming out of the production fermentation. An assumption made was that the biomass consisted of 30% protein based on literature (Salazar-López et al., 2022); this was deemed acceptable for the purpose of techno-economic analysis. The soluble protein percentage was determined empirically to be 3.6% of the cell, or 12% of total protein. Target protein, or FDH, made up 0.1% of the biomass cell or 0.3% of the total protein. The 5 L experiments yielded a biomass cell density of 6.5 g/L, with soluble protein comprising 12.6% of the cell mass (42% of total protein), and the target protein accounting for 0.6% of the cell mass (2% of total protein). The base and optimistic cases were also included as forward-looking scenarios. In the base case, the target protein percentage was projected to be three times higher than in the 5 L empirical case (i.e., 1.5% of the cell or 5% of the total protein). These projections were not achieved experimentally but are envisioned as feasible outcomes with further process optimization and scale-up. Table 1 displays the values used for the empirical, base, and optimistic cases.
Model Case | Biomass Cell Density (g/L) | Protein (% of cell) | Soluble Protein (%) | Target Protein (%) |
|---|---|---|---|---|
Empirical (1 L) | 4.2 | 30 | 3.6% of cell (12% of total protein) | 0.1% of cell (0.3% of total protein) |
Empirical (5 L) | 6.5 | 30 | 12.6% of cell (42% of total protein) | 0.6% of cell (2% of total protein) |
Base | 20 | 30 | 15% of cell (50% of total protein) | 1.5% of cell (5% of total protein) |
Optimistic | 50 | 30 | 15% of cell (50% of total protein) | 5% of cell (17% of total protein) |
2.3 Economic Assumptions
When developing the industrial-scale TEA from laboratory-scale data, we made several assumptions. Table 2 outlines the economic assumptions and their respective values used in the model for the base case. We chose an annual enzyme capacity of 80 tonnes of enzyme/year to align closely with the 88 tonnes of enzyme/year, as reported by Ferreira et al. (2018), allowing for an accurate representation of our TEA on an industrial scale. To ensure our models were comparable, we specified a consistent capacity value across the pure enzyme cases. We also used that study to guide our downstream and purification sections.
Parameter | Value | Reference |
|---|---|---|
Plant utilization | 90% (330 days) | Pett-Ridge et al. (2023) |
Cost year | 2024 | |
Capital cost contingency | 10% of direct + indirect CAPEX | |
Indirect capital cost | 42.2% of total direct CAPEX | Pett-Ridge et al. (2023) |
Fixed operating cost | 4.5% of total CAPEX | Pett-Ridge et al. (2023) |
Return on equity | 15% | |
Interest rate | 10% | Pett-Ridge et al. (2023) |
Project life | 20 years | Pett-Ridge et al. (2023) |
Capital recovery factor | 12.6% | |
Annual enzyme capacity | 80 tonnes enzyme/year | Ferreira et al. (2018) |
CAPEX = capital costs OPEX = operating costs | ||
3.1 Economic Assessment
We estimated the levelized costs of both crude and pure protein for the empirical, base, and optimistic cases, using the process parameters and assumptions outlined in Tables 1 and 2. Based on the 1 L empirical results, the specific activities were 25.0 U/mg for the crude protein and 38.7 U/mg for the purified protein. In comparison, the 5 L experiments yielded specific activities of 4.8 U/mg for the crude protein and 10.5 U/mg for the purified protein. The enzyme unit, U, represents the enzyme activity that converts 1 micromole of substrate into products per minute (Ibrahim et al., 2021). We assumed the same activity levels as those observed in the 5 L experiments for both the base and optimistic scenarios. As exhibited in Table 3, there was a wide range of capacities and protein costs across the cases.
Table 3 Summary of TEAs for empirical, base, and optimistic cases.

All process scenarios in this analysis were designed to deliver 80,000 kg of pure protein per year, either directly or through sufficient production of crude protein to meet this purified yield after downstream processing. Despite this consistent output target, substantial variation was observed in both levelized protein costs and specific process performance metrics due to differences in upstream and downstream assumptions. A clear inverse relationship was observed between levelized protein cost and two upstream parameters: biomass cell density and target protein content. In the base and optimistic scenarios, which assumed higher biomass concentrations (20–50 g/L) and increased protein expression levels (1.5–5% of cell mass), both crude and pure protein costs dropped substantially. This trend can be attributed to the fact that higher biomass densities reduce the required fermentation volume and associated fixed costs, while higher protein expression increases the proportion of biomass contributing to the final product. These improvements lessen the severity of downstream processing requirements, as cell lysis and protein purification are more efficient when product titers are high. For example, in the optimistic case, a cell density of 50 g/L and target protein content of 5% yielded a pure protein cost of $970/kg, compared to $99,000/kg in the empirical 1 L case—a more than 100-fold reduction.
An unusual observation was made in the empirical 1 L crude case, where the model projected a very high annual crude protein production capacity (2.9 million kg), yet the levelized cost remained high at $2,300/kg. This counterintuitive result can be explained by the extremely low biomass cell density in this case (4.2 g/L), which required processing exceptionally large fermentation volumes to reach the target output. The dilute broth led to high capital costs for oversized fermenters and increased operating costs associated with media, utilities, and downstream processing. In this context, the large-scale handling of low-density biomass imposes a significant economic burden, and the potential benefits of economies of scale (Elsner et al., 2015) were insufficient to offset these inefficiencies. Although the modeled capacity was high in mass terms, the process was fundamentally constrained by the cost structure imposed by dilute feedstocks, resulting in elevated unit costs.
Crude protein consistently exhibited lower costs across all scenarios compared to pure protein, primarily due to increased production capacities and the exclusion of purification equipment and associated consumables. Protein purification remains a significant technical and economic challenge. Among the various purification techniques, affinity chromatography is the most widely employed due to its reliability in achieving high yield and purity at the bench scale. However, the high cost of chromatographic resins and the operational complexity of large-scale equipment limit the feasibility of chromatography for industrial applications. As a result, many companies opt to use proteins in their crude form, bypassing extensive purification steps to reduce cost and complexity in both research and manufacturing contexts (Li et al., 2024).
The cost per unit of enzyme activity ($/U) provides further insight into the tradeoffs between crude and pure protein production. Pure proteins consistently exhibited slightly higher specific activity across all scenarios—for example, 38.7 U/mg in the empirical 1 L case. However, this also resulted in higher $/U values, in line with their elevated $/kg production costs. Despite the increased cost, this enhanced catalytic performance can offer greater reaction efficiencies and is often required in applications that demand high specificity or biochemical precision. When accuracy and performance outweigh cost and processing speed, the use of pure protein becomes more advantageous. Conversely, when large quantities are required at minimal cost, crude preparations may be more appropriate.
These findings are consistent with previous literature. For example, Ferreira et al. (2018) reported an enzyme production cost of $316/kg for intracellular β-glucosidase at an annual capacity of 88,000 kg, using a strain expressing the target protein at 5% of cell mass. Although the production capacity in their study was comparable to our pure protein scenarios, their cost was significantly lower than the values observed in our empirical cases—primarily due to a much higher target protein expression level. In our optimistic scenario, we also assumed a 5% target protein content, which yielded a more comparable cost of $970/kg. However, this remains notably higher than the $316/kg found for β-glucosidase, as differences in purification strategies likely drive the cost gap. Our use of IMAC significantly contributes to the overall enzyme production costs. Ferreira et al. (2018) measured a specific activity of 2.3 U/mg, which was lower than those observed in our empirical scenarios (Table 3). Consequently, the calculated cost per unit activity in Ferreira et al. (2018) was approximately $1.37E-4/U, which closely matches our activity cost for the empirical 5 L crude case ($1.05E-4/U). This comparison further underscores the critical role that upstream expression levels play in determining both protein cost and performance efficiency.
Finally, the comparison between the base and optimistic cases reveals diminishing returns with respect to further improvements in biomass density and protein expression. While the optimistic case achieves the lowest costs overall ($75/kg crude, $970/kg pure), the cost reduction relative to the base case is modest compared to the substantial improvements observed when transitioning from empirical to base scenarios. This suggests that beyond a certain point, additional upstream optimization yields progressively smaller economic benefits, likely due to downstream constraints such as purification yield, material recovery efficiency, and consumable costs, which begin to dominate the overall cost structure.
In summary, protein production costs were strongly influenced by upstream parameters such as biomass density and protein expression, which reduce downstream burden and enable lower levelized costs. However, scale and process integration play equally important roles, as even large-scale protein output is not economically viable if achieved through inefficient, dilute processes. Moreover, the choice between crude and pure protein should be guided by application-specific requirements, balancing cost, complexity, and performance. These results emphasize the importance of aligning process design with both technical constraints and end-use demands when evaluating the economic feasibility of enzyme manufacturing systems.
Table 4 further analyzes the cost comparisons between the two products, outlining the various capital and operating cost contributions to the base case levelized costs of the crude and pure protein. In both cases, the methanol feed rate is the same at 120,000 kg per day.
Table 4 Summary of base case TEAs for the production of crude and pure proteins.
|
|
Crude Protein |
Pure Protein |
|
|
Annual protein capacity |
800,000 kg protein/year |
80,000 kg protein/year |
|
|
Methanol feed rate |
120,000 kg/day |
120,000 kg/day |
|
|
Total capital cost |
$118M |
$268M |
|
|
Levelized capital cost |
$21/kg protein |
$467/kg protein |
|
|
% of total levelized cost |
17.78% |
13.07% |
|
|
Total operating cost |
$77M/year |
$250M/year |
|
|
Net operating cost |
$76M/year |
$248M/year |
|
|
Levelized operating cost |
$95/kg protein |
$3,103/kg protein |
|
|
% of total levelized cost |
82.22% |
86.93% |
|
|
Total levelized cost |
$120/kg protein |
$3,600/kg protein |
|
The base case TEA highlights significant cost differences between crude and pure protein production, driven largely by differences in downstream processing requirements, capital intensity, and achievable scale. First, the annual protein capacity differs by an order of magnitude: 800,000 kg/year for crude protein versus only 80,000 kg/year for pure protein. This disparity is not due to differences in upstream fermentation or feedstock input—both scenarios assume the same methanol feed rate of 120,000 kg/day—but instead reflects the additional burden of purification, which limits the amount of product that can be feasibly recovered and processed.
The lower throughput of the pure protein scenario amplifies both capital and operating costs on a per-unit basis. The total capital cost for pure protein production is more than double that of the crude case ($268 million vs. $118 million), despite the lower product output. As a result, the levelized capital cost per kilogram of protein is over 20 times higher for pure protein ($467/kg vs. $21/kg). However, capital costs account for a smaller fraction of the total levelized cost in both cases (17.78% for crude, 13.07% for pure), indicating that operating costs are the dominant economic factor.
Operating costs provide further evidence of this trend. While both systems operate with similar feed input rates, the total and net operating costs for pure protein production are over three times greater than for crude protein ($250 million/year vs. $77 million/year total operating; $248 million/year vs. $76 million/year net operating). This is primarily due to the intensive requirements of protein purification, including multiple chromatography steps, consumables, and additional buffer volumes. As a result, the levelized operating cost per kilogram is $3,103/kg for pure protein compared to only $95/kg for crude protein. Consequently, the total levelized cost of pure protein production is dramatically higher—$3,570/kg compared to $115/kg for crude protein—underscoring the cost challenges associated with achieving high-purity protein at scale.
Analysis of the data reinforces purification as the principal economic bottleneck in enzyme manufacturing. While capital cost differences are notable, the purification burden primarily manifests in ongoing operating expenses. Therefore, for applications where crude protein is functionally sufficient, the cost savings are substantial and could justify the trade-off in product quality or purity. This is exemplified in biofuel production, where enzymes—particularly cellulases—are typically used in crude form and secreted extracellularly (Gao et al., 2015), making them more feasible and cost-effective than intracellular enzymes, such as FDH, which require additional extraction and purification steps. However, the use of crude enzymes is not without drawbacks. For instance, in the case of crude FDH, there is potential for the presence of inhibitors or interfering compounds that may reduce enzyme activity (Cao, 2005). Moreover, due to the limited empirical data available in the literature, it remains too early to determine the extent to which these impurities affect performance. Conversely, in applications that demand high specificity, selectivity, or adherence to regulatory standards, the addition expense of producing purified protein may be warranted—provided that the downstream value and performance benefits justify the higher production costs.
To assess the influence of various factors, Table 5 presents a comparison of enzyme production parameters from multiple studies, emphasizing the range of costs, expression systems, and production efficiencies across different enzymes. This comparison offers critical insights into the diverse factors affecting enzyme production processes and elucidates the key determinants of cost and operational efficiency in different industrial contexts.
Table 5 Comparison of reported parameters from previous studies with those in the current study.
|
Specific Enzyme |
Enzyme Class |
Enzyme Expression |
Cell Density |
Target Protein Percentage |
Protein Production Capacity |
Fermentation Scale |
Purification Method(s) |
Capital Cost |
Operating Cost |
Enzyme cost ($/kg) |
Enzyme cost ($/U) |
Reference |
|
|
FDH (base case) |
Redox |
Intracellular |
20 g/L |
1.5% of cell |
80,000 kg/year |
200,000 L |
Diafiltration, IMAC |
$268 million |
$248 million/year |
$3,600/kg |
$3.40E-4/U |
This study |
|
|
Horseradish Peroxidase |
Redox |
- |
- |
- |
5 kg/year |
- |
Ion exchange chromatography, Ultrafiltration |
- |
- |
$1,280,000/kg |
- |
Walwyn et al. (2015) |
|
|
β-glucosidase |
Hydrolase |
Intracellular |
100 g/L |
5% of cell |
88,000 kg/year |
100,000 L |
Diafiltration |
$70.8 million |
$27.9 million/year
|
$316/kg |
$1.37E-4/U |
Ferreira et al. (2018) |
|
|
Protease |
Hydrolase |
Extracellular |
- |
- |
30,600 kg/year |
11,500 L |
- |
$308,000 |
$24,300/year |
$2.12/kg |
$8.83E-7/U |
Rao et al. (2017) |
|
|
Lipase |
Hydrolase |
Extracellular |
- |
- |
605 kg/year |
40 L |
Packed bed absorption |
$264,000 |
$2.66 million/year |
$4,400/kg |
$5.81E-3/U |
Kumar et al. (2023) |
|
|
Lipase |
Hydrolase |
Extracellular |
- |
- |
4,290 kg/year |
- |
- |
$302,000 |
$123,000/year |
$65/kg |
- |
Khoomata et al. (2018) |
|
|
Cellulase |
Hydrolase |
- |
- |
- |
5.7 million kg/year |
- |
Used, but not specified |
$18 million |
- |
$3.80-$8.80/kg |
- |
Hong et al. (2013) |
|
|
Cellulase |
Hydrolase |
- |
- |
- |
525,000-758,000 kg/year |
938,000-2,740,000 L |
- |
$22.0-$28.6 million |
$8.23-$30.6 million/year |
$15.67-$40.36/kg |
- |
Zhuang et al. (2007) |
|
|
Cellulase, Endo-β-1,4-glucanase, Laccase |
Hydrolase |
Extracellular |
- |
- |
- |
- |
- |
- |
- |
$21–$42/kg $250/kg $14/kg |
- |
Sosa-Martínez et al. (2024) |
|
|
Enzyme Cocktail |
Hydrolase |
Extracellular |
- |
- |
5,000 kg/batch (35-704 batches/year) |
8,030 L |
Diafiltration |
$4.5 million |
$3.3 million/year |
$1.92-$3.72/kg |
- |
Sosa-Martínez et al. (2024) |
|
|
U is the enzyme activity that transforms 1 micromole of substrate (i.e., CO2) into products (i.e., formate) per minute under specified conditions (Ibrahim et al., 2021) |
|||||||||||||
As shown in Table 5, TEAs of enzyme production demonstrate significant variability in cost estimates depending on scale, purification methods, and enzyme type. For example, Kumar et al. (2023) estimated lipase production at $4,400/kg using a small-scale (40 L) reactor and packed bed absorption, while our model, using a 200,000 L fermentor and two-step purification, yielded a lower cost of $3,600/kg due to economies of scale and higher throughput (80,000 kg/year versus 605 kg/year). Other studies, such as those by Ferreira et al. (2021) and Hong et al. (2013), reported cellulase costs ranging from $3.8/kg to $40/kg at much higher scales (up to 5.7 million kg/year), though often with less intensive purification or without specifying purification methods, which likely contributed to their lower reported costs.
Lipase and protease production costs estimated by Khootama et al. (2018) and Rao et al. (2017) were significantly lower than in our study, largely due to smaller scale operations without purification steps. Sosa-Martinez et al. (2024) also showed lower enzyme costs ($2-$250/kg) due to minimal purification and extracellular enzyme secretion. However, differences in purification methods—such as the use of IMAC in our study—drove up costs substantially, with IMAC alone contributing over 30% of total direct capital costs. In contrast, the TEA by Walwyn et al. (2015) reported horseradish peroxidase costs at $1.28 million/kg due to extremely small scale (5 kg/year) and costly downstream processing, illustrating how economies of scale and purification strategy are critical to cost efficiency in enzyme manufacturing. Table 5 highlights that Walwyn et al. (2015) was the only study focusing on redox enzymes, revealing a gap in TEAs for these enzymes, such as FDH, suggesting that these bioprocesses need further cost optimization.
3.2 Sensitivity Analysis
Sensitivity analyses evaluate the impact of variations in key variables or input parameters on the overall economic performance of the process. Given that this study focused on an early-stage experimental FDH production process, there was inherent uncertainty across various stages. By testing and modifying specific parameter values, researchers can identify optimal ranges that minimize enzyme costs. In the sensitivity analyses, shown in Figures 2 through 5, the effect of changes in different parameters are visually evident in the form of a tornado plot. The x-axis represents the enzyme selling price in USD per kg protein, while the y-axis specifies the parameters tested. For each parameter, the first value listed is the lower case, the second value is the base case for each particular model, and the third value is the upper case.
The sensitivity analysis represented in Figure 2 for the 1 L empirical case showed that the extent of protein purification was highly sensitive to affecting the enzyme selling price. The crude protein cost was about $2,300/kg protein, while pure protein cost was almost $99,000/kg protein, reflecting a 4,204% increase. In addition to the significant difference in annual protein capacity, the diafiltration membrane and IMAC resin materials contributed to 8.6% and 7.6% to the total variable operating costs, respectively, in the pure protein case. The IMAC equipment and materials made up about 12.6% of the total direct capital cost as well. Therefore, when we excluded the two purification steps for the crude protein production, the overall costs decreased dramatically.
Another relatively sensitive parameter was the cost of isopropyl β-D-thiogalactopyranoside, or IPTG, which increased or decreased the enzyme cost by $10,000. The IPTG cost contributed to 28.2% of the total variable operating cost. In future studies, lactose could serve as a cost-effective alternative to IPTG for induction, given its significantly lower cost of approximately $2/kg compared to $356/kg for IPTG (Xu et al., 2023), thus contributing to reduced enzyme production costs. Other parameters, such as water and substrate cost, IMAC resin replacement frequency, and electricity, similarly sensitively changed the resulting cost. The rest of the parameters tested were not significantly sensitive, demonstrating that changes in these parameters should not have a large impact on the enzyme price.
Consistent with the 1 L empirical case, protein purification remained the most sensitive parameter in the 5 L empirical model (Figure 3). The cost of crude protein was about $500/kg, whereas purified protein reached $16,000/kg, representing a 3,100% increase. Among the cost drivers, the IMAC resin replacement frequency, along with the costs of IPTG, methanol, water, and the IMAC resin itself, exhibited notable sensitivity. In this scenario, IPTG and IMAC resin contributed 21.8% and 27.9%, respectively, to the total variable operating costs. Methanol accounted for 19.8%, while water contributed 6.6%. Parameters with cost contributions lower than that of water displayed comparable sensitivity profiles, leading to protein cost variations of less than $480/kg.
The sensitivity analysis for the base case revealed that the presence or absence of purification steps was the most sensitive parameter, similar to the empirical findings. As shown in Table 3 and Figure 4, producing crude protein resulted in a substantial reduction in the enzyme selling price, decreasing from the base case value of $3,600/kg for pure protein to $120/kg for crude protein. In line with the empirical cases, variations in annual capacity and the absence of purification steps significantly reduced the cost of crude protein compared to purified protein. Other sensitive parameters included the IMAC resin replacement frequency and cost. Reducing the resin lifespan from 100 cycles to 50 cycles led to a $2,000/kg increase in enzyme cost (54.2% increase), while extending it to 200 cycles lowered the cost by about $970/kg (27.1% decrease). The base case exhibited particularly high sensitivity because IMAC accounted for 55.4% of the direct capital costs and 65.2% of the variable operating costs. Future research would benefit from exploring methods to express active FDH as an extracellular enzyme that can be recovered through filtration technologies, thereby eliminating the need for the IMAC purification step. In comparison, the 1 L empirical case showed significantly lower sensitivity, with IMAC accounting for only 12.6% of direct capital costs and resin representing 7.6% of operating costs. The 5 L case had moderate sensitivity, with IMAC contributing 32.9% and resin constituting 27.9%. As displayed in Figure 5, the optimistic scenario exhibited even greater sensitivity than the base case, with IMAC accounting for 69.5% of capital and 76.4% of variable operating costs. These findings underscore that resin replacement frequency becomes more cost-sensitive as the IMAC step carries greater economic weight in the process design. Additionally, changes in the IMAC resin cost by $500/L led to a $645/kg variation in protein cost. The remaining parameters demonstrated comparatively lower sensitivity, each resulting in cost changes of less than $170/kg protein.
As previously noted, the comparison between crude and purified protein production emerged as the most sensitive parameter among those evaluated in Figure 5. Under the optimistic scenario, altering the IMAC resin replacement frequency had a substantial impact on cost. Halving the resin lifespan resulted in a cost increase of over $580 (60.1% increase), while doubling the replacement frequency lowered the cost by approximately $290 (30.0% decrease). Among all scenarios, the optimistic case remained the most sensitive to changes in resin replacement frequency, primarily due to the considerable share of IMAC in both capital and operating expenditures. Additionally, fluctuations in the unit cost of the IMAC resin itself led to a cost change of $194. As previously noted, IMAC resin accounted for nearly 76.4% of the variable operating costs, highlighting the sensitivity of the system to this parameter. In contrast, the remaining parameters exhibited cost variations under $60 and thus had a negligible influence on the final protein selling price.
The Ferreira et al. (2018) study, which calculated an enzyme cost of $316/kg of β-glucosidase, found that consumables, including membranes, represented 23% of the unit production cost of the enzyme. Of the raw material costs, glucose and IPTG made up 47% and 41%, respectively, while kanamycin was negligible. In our base case TEA, the membranes contributed to about 3.6% of the variable operating costs, while methanol was 3.9% and IPTG was 9.8%. The largest contributor to the operating costs was the IMAC resin, accounting for 65.2%. In contrast, the Ferreira et al. (2018) publication did not include an IMAC unit in their process, which explains why methanol and IPTG costs contributed less to the operating cost in our study. Similar to our study, the authors conducted sensitivity analyses on various parameters, where increasing the biomass density significantly reduced the resulting enzyme cost, a trend also observed in our cases with different biomass cell densities. Therefore, by maximizing the biomass density in our experiments, we could lower the enzyme costs.
Walwyn et al. (2015) conducted a TEA on the production of a redox enzyme, horseradish peroxidase, including a sensitivity analysis that highlighted protein yield (activity units/g biomass) as a key target for future research and development in this area. Additionally, increasing the production capacity by 50% significantly improved project viability, reducing the enzyme cost by $183,000/kg of peroxidase. When comparing the capacities between the crude and pure proteins, we also observed large discrepancies in the resulting costs. These results emphasize the importance of optimizing both yield and scale to drive down costs and enhance the overall viability of enzyme production processes.
Another important consideration is that certain enzyme production processes produce multiple enzymes while others deliver a single enzyme. Additionally, raw materials contribute a significant amount to the overall process costs, so reducing those costs can minimize the enzyme selling price. Other factors, such as the operational scale and price sources, can also influence the costs, as both may vary depending on the specific case. Several studies have demonstrated significant cost reductions through the utilization of coproducts. For instance, in certain process simulations, companies can market the residual solid material as an animal feed supplement, while residual biomass can be combusted for energy production in the form of steam (Ferreira et al., 2021). However, our sensitivity analysis indicated that the revenue generated from the solid byproducts did not lead to substantial changes in the overall protein cost.
This study used SuperPro Designer to simulate industrial-scale production of formate dehydrogenase (FDH), a redox enzyme, integrating laboratory-scale experimental data into a scalable process model to estimate levelized costs for both crude and purified FDH across multiple scenarios. Empirical cases based on experimental data demonstrated high production costs, particularly for purified protein. However, modeled projections for base and optimistic scenarios—envisioned through increased biomass density and target protein expression—revealed significantly improved outcomes. In the optimistic case, costs ranged from $75/kg ($1.56E-5/U) to $970/kg ($9.21E-5/U), while the base case, which assumed moderate improvements, ranged from $120/kg ($2.40E-5/U) to $3,600/kg ($3.40E-4/U). Key cost drivers included biomass cell density, protein purity, and IMAC resin replacement frequency, whereas factors like electricity cost, methanol price, interest rate, and project life had relatively minor impacts. This techno-economic framework identifies critical cost levers and guides research and development toward more efficient upstream expression, downstream purification, and scale-up of redox enzymes for next-generation biomanufacturing applications.
FDH
Formate dehydrogenase
TEA
Techno-economic analysis
Ethics Approval and Consent to Participate
Not applicable
Consent for Publication
Not applicable
Availability of Data and Materials
The datasets used and/or analyzed during the current study are available from the corresponding author on reasonable request.
Competing Interests
The authors declare that they have no competing interests.
Funding
This work was supported by the Novo Nordisk Foundation (Grant no. NNF22SA0078767).
Authors’ Contributions
JC: Writing – original draft, Methodology, Formal analysis, Investigation, Conceptualization. VRB: Methodology, Investigation, Writing – review and editing, Conceptualization. CRH: Methodology, Investigation, Writing – review and editing, Conceptualization. TN: Methodology, Investigation, Writing – review and editing, Conceptualization. SS:Conceptualization, Funding acquisition, Supervision, Project administration, Writing – review and editing. NC: Conceptualization, Methodology, Supervision, Writing – review and editing. AG: Conceptualization, Methodology,Supervision, Writing – review and editing. WJS: Writing – review and editing, Methodology, Supervision, Conceptualization, Project administration.
Acknowledgements
The authors would like to thank the Novo Nordisk Foundation (Grant no. NNF22SA0078767) for funding the research.
- Baumann P, Hubbuch J (2017) Downstream process development strategies for effective bioprocesses: Trends, progress, and combinatorial approaches. Eng Life Sci 17(11):1142–1158. doi:10.1002/elsc.201600033.
- Becerra M, Cerdan E, Gonzalez Siso M (1997) Heterologous Kluyveromyces lactis β-galactosidase production and release by Saccharomyces cerevisiae osmotic-remedial thermosensitive autolytic mutants. Biochimica et Biophysica Acta 1335(3):235–241. doi:10.1016/S0304-4165(97)00048-2.
- Bierbaumer S, Nattermann M, Schulz L, Zschoche R, Erb TJ, Winkler CK, Tinzl M, Glueck SM (2023) Enzymatic conversion of CO2: From natural to artificial utilization. Chem Rev 123(9):5702–5754. doi:10.1021/acs.chemrev.2c00581.
- Calzadiaz-Ramirez L, Meyer AS (2022) Formate dehydrogenases for CO2 utilization. Curr Opin Biotechnol 73:95–100. doi:10.1016/j.copbio.2021.07.011.
- Cao L (2005) Carrier-bound immobilized enzymes: Principles, application and design. doi:10.1002/3527607668.
- Carrillo M, Wagner M, Petit F, Dransfeld A, Becker A, Erb TJ (2019) Design and control of extrachromosomal elements in Methylorubrum extorquens AM1. ACS Synth. Biol 8(11):2451–2456. doi:10.1021/acssynbio.9b00220.
- Cha J, Bak H, Kwon I (2023) Hydrogen-fueled CO2 reduction using oxygen-tolerant oxidoreductases. Front Bioeng Biotechnol 10. doi:10.3389/fbioe.2022.1078164.
- Che Hussian CHA, Leong WY (2024) Factors affecting therapeutic protein purity and yield during chromatographic purification. Prep Biochem Biotechnol 54(2):150–158. doi:10.1080/10826068.2023.2217507.
- Dahlin LR, Meyers AW, Stefani SW, Webb EG, Wachter B, Subramanian V, Guarnieri MT (2023) Heterologous expression of formate dehydrogenase enables photoformatotrophy in the emerging model microalga, Picochlorum renovo. Front Bioeng Biotechnol 11. doi:10.3389/fbioe.2023.1162745.
- Elsner W, Heinrich T, Schwardt H (2015) The ideal neoclassical market and general equilibrium. The Microeconomics of Complex Economies 97–128. doi:10.1016/b978-0-12-411585-9.00005-1.
- Fasano A, Fourmond V, Léger C (2024) Outer-sphere effects on the O2 sensitivity, catalytic bias and catalytic reversibility of hydrogenases. Chem Sci 15(15):5418–5433. doi:10.1039/d4sc00691g.
- Ferreira RDG, Azzoni AR, Freitas S (2018) Techno-economic analysis of the industrial production of a low-cost enzyme using E. coli: The case of recombinant β-glucosidase. Biotechnol Biofuels 11(1). doi:10.1186/s13068-018-1077-0.
- Ferreira RG, Azzoni AR, Freitas S (2021) On the production cost of lignocellulose-degrading enzymes. Biofuels Bioprod Biorefin 15(1):85–99. doi:10.1002/bbb.2142.
- Gao D, Luan Y, Wang Q, Liang Q, Qi Q (2015) Construction of cellulose-utilizing Escherichia coli based on a secretable cellulase. Microb Cell Fact 14(1). doi:0.1186/s12934-015-0349-7.
- Headon DR, Walsh G (1994) The industrial production of enzymes. Biotechnol Adv 12(4):635-646. doi:10.1016/0734-9750(94)90004-3.
- Hong Y, Nizami AS, Pour Bafrani M, Saville BA, Maclean HL (2013) Impact of cellulase production on environmental and financial metrics for lignocellulosic ethanol. Biofuels Bioprod Biorefin 7(3):303–313. doi:10.1002/bbb.1393.
- Ibrahim NA, Eid BM, Amin HA (2021) Sustainable textile finishing processes and pollution control based on enzyme technology. Green Chemistry for Sustainable Textiles: Modern Design and Approaches 385–415. doi:10.1016/B978-0-323-85204-3.00018-X.
- Iliuta I, Larachi F (2023) Direct-air capture conversion of CO2 in fixed-bed microreactors with immobilized formate dehydrogenase and glucose dehydrogenase: Concept feasibility. Chem Eng Res Des 193:306–319. doi:10.1016/j.cherd.2023.03.031.
- Illanes A (2008) Enzyme production. In: Illanes, A. (ed) Enzyme biocatalysis. Springer, Dordrecht. doi:10.1007/978-1-4020-8361-7_2.
- Khootama A, Putri DN, Hermansyah H (2018) Techno-economic analysis of lipase enzyme production from Aspergillus Niger using agro-industrial waste by solid state fermentation. Energy Procedia 153:143–148. doi:10.1016/j.egypro.2018.10.054.
- Klein-Marcuschamer D, Oleskowicz-Popiel P, Simmons BA, Blanch HW (2012) The challenge of enzyme cost in the production of lignocellulosic biofuels. Biotechnol Bioeng 109(4):1083–1087. doi:10.1002/bit.24370.
- Kumar SM, Asani PC, Baradia H, Chattopadhyay S (2023) Process optimization and techno-economic analysis for the production of lipase from Bacillus sp. J Taibah Univ Sci 17(1). doi:10.1080/16583655.2023.2198925.
- Léger C, Bertrand P (2008) Direct electrochemistry of redox enzymes as a tool for mechanistic studies. Chem Rev 108(7):2379–2438. doi:10.1021/cr0680742.
- Li X, Kuchinski LM, Park A, Murphy GS, Soto KC, Schuster BS (2024) Enzyme purification and sustained enzyme activity for pharmaceutical biocatalysis by fusion with phase-separating intrinsically disordered protein. Biotechnol Bioeng 121(10):3155-3168. doi:10.1002/bit.28787.
- Millipore Sigma 2025a. Formate dehydrogenase from Candida boidinii. https://www.sigmaaldrich.com/US/en/product/sigma/f8649?srsltid=AfmBOopjKeGSEqs7uNGfLxY84gXZRF_o6AzyZhx6-fgi7Dpbf0N71_kt (accessed 23 April 2025).
- Millipore Sigma 2025b. Laccase from Rhus vernificera. https://www.sigmaaldrich.com/US/en/product/sigma/l2157 (accessed 23 April 2025).
- Park J, Heo Y, Jeon BW, Jung M, Kim YH, Lee HH, Roh SH (2024) Structure of recombinant formate dehydrogenase from Methylobacterium extorquens (MeFDH1). Sci Rep 14(1). doi:10.1038/s41598-024-54205-7.
- Pett-Ridge J, Ammar HZ, Aui A, Ashton M, Baker SE, Basso B, Bradford M, Bump AP, Busch I, Calzado ER, Chirigotis JW, Clauser N, Crotty S, Dahl N, Dai T, Ducey M, Dumortier J, Ellebracht NC, Egui RG, … Aines RD (2023) Roads to removal: Options for carbon dioxide removal in the United States. Lawrence Livermore National Laboratory. https://www.osti.gov/servlets/purl/2301853.
- Peyraud R, Schneider K, Kiefer P, Massou S, Vorholt JA, Portais JC (2011) Genome-scale reconstruction and system level investigation of the metabolic network of Methylobacterium extorquens AM1. BMC Syst Biol 5. doi:10.1186/1752-0509-5-189.
- Rao RR, Vimudha M, Kamini NR, Gowthaman MK, Chandrasekran B, Saravanan P (2017) Alkaline protease production from Brevibacterium luteolum (MTCC 5982) under solid-state fermentation and its application for sulfide-free unhairing of cowhides. Appl Biochem Biotechnol 182(2):511–528. doi:10.1007/s12010-016-2341-z.
- Remans K, Lebendiker M, Abreu C, Maffei M, Sellathurai S, May MM, Vaněk O, de Marco A (2022) Protein purification strategies must consider downstream applications and individual biological characteristics. Microb Cell Factories 21(1). doi:10.1186/s12934-022-01778-5.
- Salazar-López NJ, Barco-Mendoza GA, Zuñiga-Martínez BS, Domínguez-Avila JA, Robles-Sánchez RM, Ochoa MAV, González-Aguilar GA (2022) Single-cell protein production as a strategy to reincorporate food waste and agro by-products back into the processing chain. Bioengineering 9(11). doi:10.3390/bioengineering9110623.
- Sosa-Martínez JD, Morales-Oyervides L, Montañez J, Contreras-Esquivel JC, Balagurusamy N, Gadi SK, Salmerón I (2024) Sustainable co-production of xylanase, cellulase, and pectinase through agroindustrial residue valorization using solid-state fermentation: A techno-economic assessment. Sustainability 16(4). doi:10.3390/su16041564.
- Walwyn DR, Huddy SM, Rybicki EP (2015) Techno-economic analysis of horseradish peroxidase production using a transient expression system in Nicotiana benthamiana. Appl Biochem Biotechnol 175(2):841–854. doi:10.1007/s12010-014-1320-5.
- Xu JM, Wu ZS, Zhao KJ, Xi ZJ, Wang LY, Cheng F, Xue YP, Zheng YG (2023) IPTG-induced high protein expression for whole-cell biosynthesis of L-phosphinothricin. Biotechnol J 18(9). doi:10.1002/biot.202300027.
- Zhuang J, Marchant MA, Nokes SE, Strobel HJ (2007) Economic analysis of cellulase production methods for bio-ethanol. Appl Eng Agric 23(5):679–687. https://elibrary.asabe.org/azdez.asp?search=0&JID=3&AID=23659&CID=aeaj2007&v=23&i=5&T=2.