Microorganisms, particularly filamentous fungi, have become the dominant platforms for industrial enzyme production due to their rapid growth, low cost, and adaptability. However, current production technologies face limitations in yield and cost-efficiency, prompting the need for innovative enhancement strategies. Non-thermal atmospheric-pressure plasma has emerged as a promising tool for stimulating microbial enzyme production. In this study, we evaluated the potential of microsurface dielectric barrier discharge plasma in enhancing the production of fungal (Neurospora crassa) cellulolytic enzymes. The extracellular activity of cellulases increased (approximately maximum 10% increase) after plasma treatment. The transcription levels of the four cellulase genes were significantly elevated (highest in the 120 s treatment). The fungal hyphal membrane was depolarized and chemically altered after plasma treatment. The levels of intracellular Ca2+ and nitric oxide (NO) were elevated, and a high-affinity Ca2+ influx system was activated after plasma treatment. The inhibition of Ca2+ channels and scavenging of NO reduced plasma-mediated fungal cellulase production. Plasma-mediated enhancement of enzyme production seemed to occur at plasma energies below 500–600 J. However, the combination of the plasma source type and treatment time can affect the efficiency of enzyme production. We also observed the promotion of fungal cellulase production when jet plasma was applied to larger volume of fungal hyphae. Our results suggest that plasma may be a genetically and environmentally safe tool for fungal enzyme production on an industrial scale and can be applied to bioreactors.
Research Article
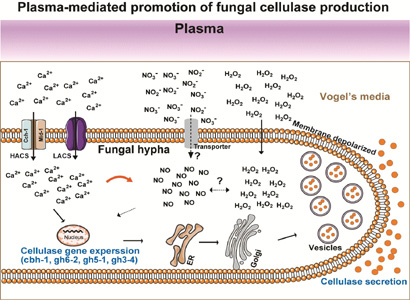
Non-thermal atmospheric-pressure plasma promotes cellulase production in Neurospora crassa
https://doi.org/10.21203/rs.3.rs-7556279/v1
This work is licensed under a CC BY 4.0 License
You are reading this latest preprint version
Micro-surface dielectric barrier discharge plasma
Cellulase production
Neurospora crassa
Calcium ion
Nitric oxide
Enzymes are biocatalysts that accelerate chemical reactions (Maghraby et al., 2023) and are widely applied to industries such as pharmaceuticals, paper production, biofuel generation, food and beverages, and clothing. Their ability to operate under mild conditions with high specificity makes them an environmentally friendly alternative to traditional chemical processes (Chapman et al., 2018). Animals, plants, and microorganisms have been used as platforms for producing enzymes on an industrial scale. Enzymes of microbial origin have several advantages over those derived from animals and plants. They are stable under various physical and chemical conditions, and microorganisms can grow rapidly even in a small-scale system (Mokrani et al., 2024). With the rapid development of genetic engineering technology and the discovery of high-yield strains in recent years, microorganisms have gradually become the main source of industrial enzymes (Deckers et al., 2020). The use of microorganisms to produce industrial enzymes offers advantages such as easy cultivation, short growth cycles, low cost, and high efficiency (Gurung et al., 2013).
According to a research report by MarketsandMarkets Blog, the global enzyme market is estimated to be valued at USD 14.0 billion in 2024 and is projected to reach USD 20.4 billion by 2029, with a compound annual growth rate of 7.8% (Hanniet et al., 2025). The expansion of economic investment indicates that market demand for industrial enzymes is constantly increasing. However, the current production technology is unable to meet the huge market demand and is accompanied by high production costs (Li et al., 2012). Therefore, researchers have explored various approaches to address supply and demand issues and minimize production costs. For example, the traditional method is to increase the transcription and secretion levels of industrial enzymes in genetically engineered strains using gene-editing technology or by adding inducers (Kant Bhatia et al., 2021). Although these approaches are feasible, several issues remain to be explored, including the safety and sustainability of genetically engineered strains, induction costs, and residue removal.
Non-thermal atmospheric-pressure plasma is a potential tool for solving problems associated with industrial enzyme production using microorganisms (Farasat et al., 2018; Kabarkouhi et al., 2024; Li et al., 2025; Veerana et al., 2021; Yu et al., 2022). Plasma is often referred to as the fourth state of matter along with solids, liquids, and gases (Langmuir, 1928; Tonks, 1967). Gas molecules are ionized in the plasma state, producing a mixture of positively charged ions, free energetic electrons (reactive species, free radicals), and neutral particles (Flannery, 1983). Plasma is generally considered an environmentally friendly tool because it does not require the use of harmful chemicals (only ions are generated by ionized air) (Ekezie et al., 2017). This characteristic aligns with the growing demand for sustainable and environmentally friendly production processes. Compared to other strategies to promote enzyme production, plasma has great advantages in industrial enzyme production. Plasma processing equipment can be simply constructed, and the gases used for plasma generation (such as air) are relatively low-cost, thus minimizing the overall production costs. Plasma processing is additionally highly scalable and can be adapted to different production scales (from small- to large-scale production of microbial enzymes).
Although plasma shows great application potential for industrial enzyme production, several issues still need to be further explored, including accumulating more evidence on plasma-mediated enhancement of enzyme production using various microbial species, plasma devices, and feeding gases; elevating the efficiency of and yield of enzyme production; elucidating the underlying mechanisms for plasma-mediated production of microbial enzymes; and optimizing plasma equipment, processing conditions, and microbial species (type of plasma device, treated objects, and distance). Neurospora crassa is a model filamentous fungus and a natural producer of cellulases, which represent the third most widely used industrial enzymes (Waters et al., 2017). Previous studies have shown that jet plasma treatment can promote extracellular cellulase production in N. crassa (Yu et al., 2022). In this study, we analyzed the effects of micro-surface dielectric barrier discharge (MS-DBD) plasma, another plasma type, on enzyme production in N. crassa and investigated the underlying mechanisms. Unlike previous studies that used jet plasma, we used MS-DBD plasma to examine its potential in promoting enzyme production. The findings provide experimental evidence to establish a database for a solid theoretical foundation for future industrial applications of plasma technology.
Plasma devices
The main plasma device used in this study was an micro-surface dielectric barrier discharge (MS-DBD) plasma, as described by Ji et al (2019) (Fig. 1a). Plasma was generated using an electric power of 1.2 kV input voltage and 50–63 mA current using air as a feeding gas with 1.5 L/min flow rate. A plasma jet device (Supplementary Figure S1) that was newly constructed was also used with different electric powers (2.1 W or 9.4 W) in several experiments. The configuration of the plasma jet device was as follows: a dielectric glass tube containing a needle electrode was placed inside a ground metal electrode with a gap of 1 mm between the dielectric glass end and the tip of the ground metal electrode (Supplementary Figure S1). All plasma devices were provided by the Plasma Bioscience Research Center at Kwangwoon University (Seoul, Korea). Air was supplied to the plasma devices at 1.5 L/min to generate plasma.
A high-voltage probe was connected to a high-voltage electrode (Tektronix, Beaverton, OR, USA), and a current probe (LeCroy, Chestnut Ridge, NY, USA) was connected to the ground electrode to measure the voltage and current during plasma generation. During the plasma discharge, the current and voltage were measured using an oscilloscope (LeCroy). The emission spectra of different reactive species were monitored using a spectrometer (HR4000, Ocean Optics, Dunedin, FL, USA).
The energy during plasma discharge can be calculated using Eq. (1), where t1 and t2 are the initial and final time durations for one complete cycle, respectively. The duty ratio (DR) of the plasma was determined using Eq. (2). Eq. (3) was used to evaluate the dissipated power (Pdiss).

Fungal strains and plasma treatment
N. crassa strains, FGSC 4200 (wild type, genotype ORS-SL6a, mating type mat a) and FGSC 11707 (knockout mutant of mid-1, genotype Δmid-1/NCU06703, mating type mat a), obtained from Fungal Genetics Stock Center (FGSC, Manhattan, KS, USA), were used in this study. FGSC 4200 strain was maintained on Vogel’s minimal (VM) agar, and FGSC 11707 strain on VM agar medium supplemented with 200 µg/mL hygromycin (Calbiochem, San Diego, CA, USA). To obtain spores, the fungus was inoculated onto VM agar media in a flask and cultured at 30°C in darkness for two days and then at 25°C in light for 12 days. Sterile deionized (DI) water (50 mL) was added to the flask, which was vigorously shaken. The fungal suspension was filtered through three layers of sterile Miracloth (EMD Millipore, Burlington, MA, USA), and the spore suspension was centrifuged at 3,134 ×g for 5 min. After discarding the supernatant, the pellet was resuspended in sterile DI water.
A spore suspension of N. crassa was inoculated into 30 mL of VM containing 2% (w/v) glucose (1 × 10⁶ spores/mL) and placed in a glass Erlenmeyer flask (85 mm diameter, 140 mm height, 34 mm neck diameter). The flask was incubated at 25°C with shaking (200 rpm) under constant light for 24 h. Fungal mycelia were then collected by filtration through two layers of Miracloth (EMD Millipore) and washed with deionized water. Fungal hyphae were suspended in 25 mL fresh VM medium without a carbon source, and the suspension was transferred to a 90 mm petri-dish (Fig. 1). MS-DBD plasma was then applied to fungal hyphae in a petri-dish, as presented in Fig. 1a. After the plasma treatment, the fungal hyphae were transferred to a flask containing VM without a carbon source, and 5 mL of 12% (w/v) glucose (Duksan, Seoul, South Korea) or avicel (Avicel PH-101, Sigma-Aldrich, St. Louis, MI, USA) was added to each flask to obtain a final concentration of 2% (w/v) (Fig. 1a). Flasks were incubated at 25°C with shaking (200 rpm) under constant light for the indicated time.
Determining the activity of cellulolytic enzymes and the concentration of total protein
The production of cellulases by N. crassa was assessed by measuring cellulolytic activity and total protein concentration in the media. Fungal hyphae were treated with plasma and transferred to induction (avicel in media) or no-induction (glucose in media) media, as described earlier. After incubation for 24 and 48 h, the culture media were harvested and centrifuged at 2390 × g for 10 min to remove the hyphae. The supernatant was stored at 4°C until further analyses. Cellulolytic activity in the culture supernatant was measured by determining the rate of filter paper degradation (FPase) by enzymes in the culture supernatant, as described previously (Yu et al., 2022). The total protein concentration in the culture supernatant was measured using a Bradford protein assay kit (Bio-Rad, Hercules, CA, USA).
To measure FPase activity, a reaction mixture containing Whatman filter paper no. 1 (substrate; 2.2 mg filter paper), 30 µL of 0.1 M acetate buffer (pH 5.6), and 30 µL of culture supernatant was incubated at 50°C for 30 min. The level of liberated reducing sugars (the product of the enzymatic reaction) was measured by adding 120 µL of 3,5-dinitrosalicylic acid (DNS; Sigma-Aldrich) into a reaction mixture and then boiling the reaction mixture for 10 min. Finally, 720 µL of deionized water was added to the reaction mixture, and the solution absorbance was measured at 540 nm using a microplate reader (BioTek, Winooski, VT, USA). The amounts of the products (reducing sugars) were calculated using a maltose standard curve. Enzyme activity is indicated in international units (IU), where one IU is defined as the amount of enzyme that can produce 1 µM of reducing sugars (product) per min.
To measure the protein concentration, 10 µL of culture supernatant was placed in each well of a 96-well plate, and 200 µL of Bradford solution was added to each well. After incubation for 5 min at 25°C in the dark, the solution absorbance was measured at 595 nm using a microplate reader (BioTek).
Specific FPase activity was calculated by dividing the FPase activity by protein concentration. The relative percentages (%) of FPase activity, protein concentration, and specific FPase activity of the plasma-treated sample compared to those of the control (untreated sample) were calculated as follows: (FPase activity, protein concentration, or specific FPase activity of the plasma-treated sample/average value of FPase activity, protein concentration, or specific FPase activity of the control) × 100.
Analysis for membrane potential and levels of intracellular NO and Ca
The membrane potential and levels of intracellular Ca2+ and NO were analyzed as previously described (Yu et al., 2023). Fungal mycelia were harvested at the indicated incubation times after plasma treatment, as described in earlier section. The harvested fungal mycelia were washed twice with 1× phosphate-buffered saline (PBS). For detecting membrane potential, fungal mycelia were placed in 500 µL of 50 µg/mL bis-(1,3-dibutylbarbituric acid) trimethine oxonol (DiBAC4(3); Invitrogen, Carlsbad, CA, USA) and incubated at 4°C in the dark for 1 h. For detecting intracellular Ca2+, fungal mycelia were placed in 500 µL of 10 µM Fluo3-AM (Invitrogen) and incubated at 25°C in the dark for 1 h. For detecting intracellular NO, fungal mycelia were placed in 500 µL of 20 µM 4-amino-5-methylamino-2′,7′-difluorofluorescein diacetate (DAF-FM DA, Thermo Fisher, Waltham, MA, USA) and incubated at 25°C for 1 h. After incubation, the fungal mycelia were washed with 1× PBS at least three times and examined under an FV-100 MPE confocal laser scanning microscope (Olympus Corporation, Tokyo, Japan).
cPTIO, SNP, and LaCl treatment
After plasma treatment, the effect of scavenging of intracellular nitric oxide (NO), addition of NO, or inhibition of Ca2+ channel on enzyme production was examined using NO scavenger (cPTIO: 2-(4-carboxyphenyl)-4,5-dihydro-4,4,5,5-tetramethyl-1H-imidazolyl-1-oxy-3-oxide), NO donor (SNP: sodium nitroprusside), or Ca2+ channel blocker (LaCl3: lanthanum(III) chloride). As presented in Fig. 1a, N. crassa spores were inoculated into 30 mL of VM liquid containing 2% (w/v) glucose (1 × 10⁶ spores/mL). After incubation for 24 h, the fungal mycelia were recovered and resuspended in VM liquid without a carbon source. The fungal mycelial suspension was exposed to MS-DBD plasma for 0, 120, or 300 s, and avicel (final conc. 2%), supplemented with cPTIO (final conc. 10 mM: Calbiochem, San Diego, CA, USA), SNP (final conc. 0.1 mM: Sigma-Aldrich), or LaCl3 (final conc. 5 mM: Sigma-Aldrich) was added immediately to the suspension after the plasma treatment.
Measurement of pH, oxidation-reduction potential (ORP), electrical conductivity (EC), and levels of hydrogen peroxide (H2O2) and nitrogen oxides (NOx; NO, NO2−, NO3−) in media
VM media without fungal hyphae was treated with plasma and then analyzed. The EC, ORP, and pH of treated media were measured using a PCTSTestr™ 50 Waterproof Pocket pH/Cond/TDS/Salinity Tester (Oakton Instruments, Vernon Hills, IL, USA), an ExStikTM Model RE300 waterproof ORP meter (Extech, Nashua, NH, USA), and a portable pH meter (Oakton Instruments), respectively. H2O2 and NOx levels in media were measured using an AmplexTM Red Hydrogen Peroxide/Peroxidase Assay Kit (Molecular Probes, Eugene, OR, USA) and QuantiChromTM Nitric Oxide Assay Kit (BioAssay Systems, Hayward, CA, USA), respectively, according to the manufacturer's instructions.
Quantitative real-time PCR analysis and protein gel electrophoresis
Fungal mycelia were collected at the indicated incubation times after the plasma treatment, and immediately frozen and ground in liquid nitrogen. The total RNA was extracted from the ground mycelia powder using RNAiso Plus (TaKaRa Bio, Shiga, Japan), and cDNA was synthesized using ReverTra Ace qPCR RT Master Mix with gDNA Remover (Toyobo, Osaka, Japan) following the manufacturer’s protocol. Real-time PCR was performed using iQ SYBR Green Supermix (Bio-Rad) and a CFX 96TM Real Time Instrument (Bio-Rad) following the manufacturer's instructions. The mRNA levels for each enzyme were normalized to the reference gene (β-actin) and determined as follows: mRNA level of enzyme gene = 2−∆∆Ct, where ∆∆Ct = (Ct target − Ct reference)plasma treatment − (Ct target − Ct reference)control (Livak & Schmittgen, 2001). The primer sequences are listed in Table 1.
|
Genes |
Primer sequences |
|---|---|
|
β-actin |
Forward- 5′-TGA TCT TAC CGA CTA CCT-3′ |
|
Reverse- 5′-CAG AGC TTC TCC TTG ATG-3′ |
|
|
cbh-1 |
Forward- 5′-ATC TGG GAA GCG AAC AAA G-3′ |
|
Reverse- 5′-TAG CGG TCG TCG GAA TAG-3′ |
|
|
gh6-2 |
Forward- 5′-CCC ATC ACC ACT ACT ACC-3′ |
|
Reverse- 5′-CCA GCC CTG AAC ACC AAG-3′ |
|
|
gh5-1 |
Forward- 5′-GAG TTC ACA TTC CCT GAC A-3′ |
|
Reverse- 5′-CGA AGC CAA CAC GGA AGA-3′ |
|
|
gh3-4 |
Forward- 5′-AAC AAG GTC AAC GGT ACG TGG-3′ |
|
Reverse- 5′-TCG TCA TAT CCA TAC CAC TGT TTG-3′ |
|
|
nit-2 |
Forward- 5′-CGAACAAGCAGTCCGATCACCAG-3′ |
|
Reverse- 5′-GCCACCATCCTCCTCGTCTCC-3′ |
|
|
nit-3 |
Forward- 5′-AACGACCTCGCCAGCACTC-3′ Reverse- 5′-TGTTGGTGTTGGTGTTGGATGAG-3′ |
|
nit-4 |
Forward- 5′-GCAACAGCAACAGCAACAGCAG-3′ Reverse- 5′-TCCACCTCCTACCGTCGTCATTC-3′ |
|
nit-6 |
Forward- 5′-CAGGAGCGGTTCAAGCAGTTC-3′ Reverse- 5′-GCCACATCACGGGTCTTTCTTG-3′ |
|
nit-10 |
Forward- 5′-TGACGACGACGACGAAGATGG-3′ Reverse- 5′-GAATGGTGGTGGTGTTGGAAGG-3′ |
For protein gel electrophoresis, fungal mycelia were removed by centrifugation, and culture supernatants were collected 24 and 48 h after plasma treatment, as described in earlier section. Sample buffer (5×) was added to the culture supernatant, and the mixture was boiled for 5 min. The sample (20 µL or 3µg) was loaded onto a sodium dodecyl sulfate (SDS)-polyacrylamide (12%) gel. The gel was run at 140 V for approximately 1 h and 30 min and then stained overnight using Coomassie blue R-250 (Bio-Rad) for 12 h. The gel was then washed using the destain solution to remove the background stain. Finally, the gel was imaged using a ChemiDocTM MP imaging system (Bio-Rad) and analyzed using ImageJ software version 1.52a (National Institute of Health, Bethesda, MD, USA).
Analysis for Raman spectroscopy
Fungal mycelia were treated with plasma for 300 s, as described in earlier section, and the hyphae were harvested immediately after treatment. Harvested fungal mycelia were washed with 1× PBS and mounted on glass slides for Raman spectroscopy. The samples were examined using a Raman microscope (WITec alpha300, Oxford Instruments, Abingdon-on-Thames, England) with an excitation wavelength of 488 nm at 50× magnification. The laser power was fixed at 3 mW, and the integration time was maintained at 5 s, with 15 accumulations. Each measurement was repeated three times to identify the noise calibrated by smoothing and baseline correction.
Statistical Analysis
All data are presented as the mean ± standard deviation (SD) from at least six replicates. A paired Student’s t-test and two-way analysis of variance were performed, followed by Tukey’s post-hoc test. A p-value < 0.05 was considered statistically significant. SPSS Statistics Software version 25 (IBM, Chicago, IL, USA) was used for statistical analysis.
MS-DBD plasma treatment can enhance the production of cellulases in N. crassa
The voltage and current profiles during the discharge of the MS-DBD plasma (Fig. 1a) are described in a previous study (Ji et al., 2019). Plasma was generated with 1.2 kV input voltage and 62 mA current using 1.5 L/min air as the feeding gas (Ji et al., 2019). The optical emission spectra (OES) of the plasma showed excited nitrogen species corresponding to the nitrogen second positive system (Ji et al., 2019).
Generally, cellulase production is induced by cellulosic materials in the media (Oguntimein et al., 1992). We analyzed enzyme activity under non-induction (glucose-containing media) and induction (avicel; cellulose powder in the media) conditions. In media containing glucose (non-induction conditions), cellulolytic activity, measured as FPase activity (total activity of enzymes degrading cellulose in filter paper), was not significantly different between untreated and MS-DBD plasma-treated samples (Fig. 1b and Supplementary Table S1). The total protein level detected in the medium after 24 h was slightly reduced upon plasma treatment, and no significant change was observed after 48 h (Fig. 1b and Supplementary Table S1). In media containing avicel (induction condition), FPase activity significantly increased 24 and 48 h after MS-DBD plasma treatment for 120–600 s (Fig. 1b and Supplementary Table S1). After 24 h of incubation, FPase activity in the media increased up to 10.41% in the plasma-treated sample (plasma treatment for 300 s) (Fig. 1b and Supplementary Table S1). The total protein concentration in the media after 24 h was not significantly different between the non-plasma- and plasma-treated samples, except for a 10 s plasma-treated sample, which showed a 6.43% increase (Fig. 1b and Supplementary Table S1). The specific activity of FPase (total FPase activity divided by total protein amount) was significantly higher after plasma treatment for 120 s, 300 s (highest 9.03% increase), and 600 s (Fig. 1b and Supplementary Table S1). After 48 h of incubation, FPase activity in the media was significantly higher in samples treated with plasma for 10 (highest 10.36% increase), 120, 300, and 600 s than in the control (no plasma) sample (Fig. 1b and Supplementary Table S1). The total protein concentration in the media was significantly higher in samples treated with plasma for 10 s (the highest increase of 6.30%) (Fig. 1b and Supplementary Table S1). The specific activity of FPase was significantly higher in the 600 s plasma-treated sample (8.63% increase) (Fig. 1b and Supplementary Table S1).
We also investigated whether enhanced cellulase activity in media resulted from increased levels of four enzymes, two cellobiohydrolases (cbh1 and gh6-2), an endoglucanase (gh5-1), and a β-glucosidase (gh3-4), which might be secreted into media and be involved in the degradation of filter paper (Phillips et al., 2011). The transcription levels of genes encoding the four cellulolytic enzymes significantly increased when the fungi were treated with plasma for 120 s (Fig. 1c). The mRNA levels of gh6-2 and gh3-4 in the plasma-treated fungal cells for 300 s were significantly higher than those in the control sample (Fig. 1c). The levels of cellulolytic enzymes secreted into the culture medium were assessed by profiling the secreted proteins in the medium using SDS-PAGE. When the same volume of culture medium (20 µL) or the same amount of proteins (3 µg) from each treatment was loaded, no obvious difference in the intensity of the four enzyme protein bands was observed between the no plasma and plasma-treated samples after incubation for 24 and 48 h (Supplementary Figure S2).
MS-DBD plasma treatment can change the physical and chemical properties of the culture medium
To determine whether plasma changes the physicochemical properties of the culture media, we measured the pH, EC, and ORP of the VM medium immediately after plasma treatment. There was no dramatic change in the pH, ORP, or EC of the medium after plasma treatment, although the pH was very slightly reduced and the EC increased after plasma treatment for a certain amount of treatment time (Fig. 2a). After plasma was applied to the media for 120 s and 300 s, the concentration of H2O2 increased from 0.61 µM (0 s) to 1.50 µM (120 s) and 2.09 µM (300 s), respectively (Fig. 2b). NOX (NO, NO2−, and NO3−) levels in culture media increased from 26.82 mM (0 s) to 27.51 mM (120 s) and 27.66 mM (300 s), respectively (Fig. 2b). We further explored whether the changes in NOX and H2O2 concentrations were related to fungal cellulase production. We treated the fungi with different concentrations of H2O2, NO2−, or NO3−, using chemicals. Our results showed that the total protein concentration increased significantly in all treated groups compared to that in the untreated group. FPase activity increased only in the H2O2 and NO2−-treated groups, and specific enzyme activity increased only in the NO2−-treated group (Fig. 2c).
We treated the VM medium with plasma and cultured the fungi in the plasma-treated medium for 24 and 48 h. After fungi grew in the plasma-treated medium, the FPase activity, total protein concentration, and specific enzyme activity were significantly higher than those in the untreated medium, mostly after 48 h of incubation (Fig. 2d and Supplementary Table S2).
MS-DBD plasma induces cell membrane depolarization and chemical changes
The cell membranes of fungal hyphae were significantly depolarized immediately after plasma treatment (0 h of incubation) compared to those of untreated hyphae (Fig. 3a and Supplementary Figure S3a). After 24 h of incubation, the difference in depolarization between the plasma-treated and untreated samples slightly diminished (Supplementary Figure S3b).
Raman spectral analysis was performed to examine the chemical changes in the components of the fungal cell membrane. The tips of several different fungal hyphae were scanned to acquire information from many areas (Fig. 3b). Raman spectral peaks detected on the tips of fungal hyphae in the plasma-treated (300 s) and untreated (0 s) samples are presented in Fig. 3c. Each Raman peak was analyzed in terms of wavelength, functional group bonding, and chemical identity (Table 2). The Raman peaks at 1655, 1602, 1455, and 1440 cm− 1 likely correspond to C = C stretching, C = C in-phase stretching of ergosterol, C-H bending, and C-H bending of the aliphatic chain included in the lipid spectra, respectively (Table 2 and Fig. 3c) (Noothalapati et al., 2016). The level of peaks at 1655, 1455, and 1440 cm− 1 was slightly higher in plasma-treated than untreated fungal hyphae (Fig. 3c). Raman band at 850 cm− 1 seemed to be a tyrosine band from proteins in cytoplasm (Noothalapati et al., 2016), and no difference in peak level was observed between plasma-treated and untreated fungal hyphae (Table 2 and Fig. 3c). Bands below 1000 cm− 1 indicating the presence of polysaccharides, such as those at 550 and 424 cm− 1 (Noothalapati et al., 2016), were more prominent in plasma-treated samples than in untreated samples (Table 2 and Fig. 3c). Interestingly, a new peak at approximately 2964 cm− 1 was observed in the plasma-treated fungal hyphae, which is known to be the CH3 asymmetric stretching of n-pentane (Qiao & Zheng, 2005). The broad spectral band beyond 2900 cm− 1 represents a typical O-H stretching mode from water molecules (Fig. 3c) (Durickovic, 2016).
Raman shift (cm− 1) | Vibrational mode | Peak assignment |
|---|---|---|
2964 | CH3 asymmetric stretching | n-pentane |
1655 | C = C (Stretching) | |
1602 | C = C (in-phase stretching) | Ergosterol |
1455 | C-H (Bending) | - |
1440 | C-H (Bending) | Aliphatic chain |
850 | Tyrosine residue in protein | |
550 | Glycosidic band in dextran | |
424 | Skeletal vibration | Non-specific glucan |
MS-DBD plasma enhances the production of cellulases through accelerating Ca2+ influx
Because we previously observed that the expression of cellulase mRNAs is regulated by Ca2+ and NO (Yu et al., 2022), which are important intracellular secondary messengers during plasma stimulation (Kawase et al., 2020; Li et al., 2017), intracellular Ca2+ levels were assessed by fluorescent staining. The fluorescence intensity (an indicator of intracellular Ca2+) increased in plasma-treated fungal hyphae after incubation for 4, 24, and 48 h (Fig. 4a and Supplementary Figure S4). However, no difference in the fluorescence intensity was observed between 120 and 300 s plasma treatment (Fig. 4a and Supplementary Figure S4).
To further verify that plasma promoted fungal cellulase production by enhancing Ca2+ accumulation in cells, we inhibited Ca2+ influx by blocking Ca2+ channels on the cell membrane (LaCl3). When the Ca2+ channel blocker LaCl3 was applied to fungal hyphae, FPase activity and protein concentration in the media, as well as intracellular Ca2+ levels (fluorescence intensity), decreased in both untreated and treated plasma samples (Fig. 4b, Supplementary Table S3a, and Supplementary Figure S5). This indicates that plasma can activate Ca2+ channels in the cell membrane, but not Ca2+ stores (endoplasmic reticulum, Golgi apparatus, and vesicles). The mRNA levels of the two plc genes, which are signaling molecules that trigger the opening of channels on calcium storage membranes, did not change significantly after plasma treatment (Supplementary Figure S6).
MS-DBD plasma was also applied to the knockout mutant, mid-1, encoding a putative protein comprising a high-affinity Ca2+ influx system (HACS) that activates the downstream transcription factor crz1 for cellulase production (Liu et al., 2015; Muller et al., 2001; Randhawa et al., 2024). The deletion of mid-1 inhibited the growth of fungal hyphae in VM (Supplementary Figure S7a). When the mid-1 mutant was treated with MS-DBD plasma and grown in avicel media, the FPase activity and protein concentration in the media did not differ between the untreated and treated mid-1 mutants after 24 and 48 h (Supplementary Figure S7b and Supplementary Table S3b). However, the intracellular Ca2+ concentration increased slightly in the mid-1 mutant after MS-DBD plasma treatment (Supplementary Figure S7c).
MS-DBD plasma-mediated enhancement of enzyme production may be related to endogenous generation of NO
Levels of intracellular NO stained with a fluorescent dye (intensity of the green fluorescence) increased after MS-DBD plasma treatment (Fig. 5a and Supplementary Figure S8). We found that the relative FPase activity, total protein concentration, and specific FPase activity in the media significantly decreased after cPTIO (an NO scavenger) was added to both untreated and treated plasma samples (Fig. 5b and Supplementary Table S4a). When fungal hyphae (no plasma treated) were treated with SNP (exogenous NO donor), the relative FPase activity and total protein concentration in the media significantly increased without a significant change in relative specific FPase activity, indicating that extracellular NO accelerates the secretion of all proteins, not specifically cellulases (Fig. 5c and Supplementary Table S4b).
Since intracellular NO can be generated during nitrate reduction in cells, we also examined the expression of enzymes involved in nitrate assimilation. NO3− can enter cells through nitrate transporters on the cell membrane and is gradually reduced to NO2− and then to NO by nitrate reductase (NR) and nitrite reductase (NiR) (Bender & Schwarz, 2018; Marcos et al., 2016). The mRNA expression levels of the nitrate transporter (nit-10), nitrate reductase (nit-3), nitrite reductase (nit-6), and positive regulators of nit-3 (nit-2 and nit-4) did not change significantly after plasma treatment (Fig. 5d).
Our results demonstrated an increase in the intracellular levels of Ca2+ and NO after plasma treatment. We explored the relationship between the Ca2+ and NO levels in fungal cells after plasma treatment. The addition of LaCl3 significantly reduced intracellular NO levels under MS-DBD plasma treatment (Fig. 6a and Supplementary Figure S9a). The intracellular NO levels in the mid-1 mutant strain (FGSC11707) were significantly lower than those in the wild-type strain (FGSC 4200) after plasma treatment under the same conditions (Fig. 6b and Supplementary Figure S9b). In contrast, the addition of cPTIO did not dramatically affect intracellular Ca2+ levels in MS-DBD plasma treated hyphae (Fig. 6c and Supplementary Figure S10).
"Plasma dosage" effect on the efficiency of fungal cellulase production
To clarify the relationship between “plasma dose (plasma type, electric power, and treatment time)” and cellulase production efficiency, we used three types of plasma with different powers (1.5 J/s MS-DBD plasma, 9.4 J/s Jet plasma-1, and 2.1 J/s Jet plasma-2) to treat fungal hyphae in media containing avicel (inducer). Although different types of plasma with different powers were used, we defined the “plasma dose” as the plasma energy (electric power of plasma × treatment time) and compared the enzyme production efficiency according to plasma energy to determine the generalized dosage effect. When all replicate data points corresponding to the plasma energy were placed on the graph, there was a range of plasma energies resulting in the enhancement of FPase activity, protein concentration, and specific FPase activity (Fig. 7 and Supplementary Table S5). The activity of cellulases in the media increased under upto approximately 500–600 J of plasma energy (Fig. 7 and Supplementary Table S5).
Our results demonstrated that all types of plasma (Jet and MS-DBD) promoted the production of cellulases by N. crassa in the avicel medium (Fig. 7 and Supplementary Table S5). However, under the same plasma energy, jet plasma with high power (9.4 W) showed the highest efficiency in enzyme production (~ 200%) when treated for a short time (within 60 s) compared to jet plasma with low power (2.1 W) and MS-DBD plasma (Fig. 7 and Supplementary Table S5). In addition, the efficiency of cellulase production decreased with longer incubation times. The relative increase in percentage was reduced after 48 h of incubation compared to that after 24 h of incubation (Fig. 7). Enzyme activity was also elevated in glucose media in several plasma treatments (Supplementary Table S5). However, the relative FPase activity and specific enzyme activity increased in a plasma energy-dependent manner only under induction conditions.
Potential of plasma as a tool for enhancing the efficiency of industrial-scale production of cellulases
The effect of a large-scale (300 mL; 10-fold increase in fungal culture volume) treatment was also analyzed to examine the potential of plasma for industrial-scale applications. For this experiment, we used jet plasma with 2.1 J/s power because jet plasma was more effective than MS-DBD plasma, and the treatment area of MS-DBD plasma was limited (Fig. 8a). The total enzyme activity in the media (with avicel) was significantly elevated up to a maximum of 20%, compared with the untreated group, after 24 and 48 h of plasma treatment for 300–900 s (Fig. 8b and Supplementary Table S6). The total protein content in the media did not significantly change in most treatment groups, and the specific enzyme activity was significantly elevated after 24 and 48 h of plasma treatment for 300–900 s (Fig. 8b and Supplementary Table S6). No significant increase in enzyme activity was observed in media without avicel (only glucose) (Supplementary Table S6). This indicates that jet plasma can enhance fungal cellulase production on a large scale in the presence of avicel (an inducer).
In this study, we provide another experimental evidence that non-thermal atmospheric-pressure plasma enhances the extracellular production of cellulases by N. crassa using plane-type MS-DBD plasma. Plane-type MS-DBD plasma was generated between microelectrodes embedded in a glass plate, resulting in the entire surface area of the plate (diameter 90 mm) being filled with plasma. In contrast, in jet plasma, plasma is generated in feeding gas nozzle. The plasma plume and sample cannot come into direct contact in treatment with plane-type MS-DBD plasma, whereas direct contact between the plasma plume and sample is possible in treatment with jet plasma. Our results indicate that jet plasma treatment is more effective at enhancing enzyme production than plane-type MS-DBD plasma treatment. After 2–5 min of treatment, a maximum increase of approximately 10% in cellulase activity in the media was observed with MS-DBD plasma in this study, whereas a 20% increase was observed with jet plasma (Yu et al., 2022). Interestingly, jet plasma treatment at higher power (9.4 W) for short duration was more effective in increasing fungal enzyme production than treatment at lower power (2.1 W). Our qPCR analysis suggests that the increased enzyme production results from an elevated expression of cellulase genes.
Studies on plasma-mediated enhancement of microbial enzyme production are limited. Several studies have focused on plasma-mediated mutagenesis to generate microbial strains with high enzymatic activity (Li et al., 2025; Zhang et al., 2014). These studies used a very high dose of plasma, which caused the death of over 90% of the fungi. However, in our study, a low dose of plasma (most microorganisms were alive) was applied to the microorganisms, and this treatment condition might not be enough to cause microbial mutations. Very few studies have reported results similar to ours, in that plasma can promote enzyme expression and secretion in non-mutated microbial strains (Kabarkouhi et al., 2024; Farasat et al., 2018). Genetically engineered strains harboring recombinant enzyme genes have frequently been developed for industrial-scale production (Dadwal et al., 2020). However, the limited efficiency of protein expression and secretion can be a bottleneck for the application of engineered strains in the production industry. The results from our and other studies suggest that plasma can be a potential and safe tool for improving the efficiency of extracellular enzyme production without causing mutations. In several studies, catalytic activity was improved through non-mutagenic applications of plasma such as plasma pretreatment of substrates, enzymes, or a mixture of substrates and enzymes (Abolore et al., 2025; Chen et al., 2025; Dirks et al., 2025; Wapshott-Stehli et al., 2022; Yayci et al., 2020). In these studies, the improvement of catalytic activity through influence on enzyme structure or substrate susceptibility was the main target for analysis after plasma treatment.
Our results demonstrated that plasma-mediated enhancement of fungal enzyme production was observed in avicel media but not in glucose media. Avicel is a microcrystalline form of cellulose, and fungal cellulolytic enzyme production is induced by the addition of avicel to media (Coradetti et al., 2013). The degradation of cellulose by conidial-bound cellulases is initiated, producing disaccharide cellobiose, which enters the cells and further activates the transcription and expression of cellulase (Suto & Tomita, 2001; Yan et al., 2021). The concentration of cellobiose is proportional to the induction effect, as these molecules are transported into fungal cells through transporters on the cell membrane and induce the expression of cellulase genes (Yan et al., 2021). In our study, it is possible that plasma accelerated the direct degradation of avicel in media, and cellobiose, the degradation product, was transported into the cell and induced cellulase production. However, plasma did not seem to be involved in the direct degradation of cellulose in media in our study because cellulose was added to the medium after plasma treatment (no contact with plasma). In addition, no significant change in the level of reducing sugars (no elevation of degradation) was observed when plasma was directly applied to the avicel medium for the time interval used in our study (Supplementary Figure S11a). Another possibility is that plasma treatment reduces the stability of the cellulose structure, making cellulose more easily and rapidly degraded by cellulase, ultimately increasing the concentration of cellobiose in the culture environment and accelerating the production of fungal cellulase.
Our cellular and molecular analyses provide several clues in terms of the mechanisms underlying the enhancement of cellulase production by plasma. The plasma-mediated elevation of cellulase production may have resulted from enhanced fungal growth after plasma treatment. This may be plausible because we observed a significant increase in fungal hyphal dry weight 48 h after plasma treatment for a time duration (120–300 s) showing the promotion of enzyme production (Supplementary Figure S11b). A significant increase in enzyme production was observed after 24 h of incubation; however, fungal growth did not always show a significant increase during 24 h incubation (Supplementary Figure S11b). This indicates that, beyond fungal growth, other factors affected by plasma may lead to enhanced enzyme production.
Another possibility is that plasma may have changed the physical and chemical properties of the cell membrane, such as the membrane potential and chemical properties, which may have affected the opening of membrane transporters and channels, leading to ion and sugar influx. According to our data, the N. crassa cell membrane appeared to be depolarized after plasma treatment. In addition, Raman spectroscopy suggested chemical alterations in the lipids and proteins of the cell membrane and the glucans of the cell wall after plasma treatment. Depolarization of mammalian cell membranes can trigger the opening of Ca2+ channels or Ca2+ pumps (Catterall, 2011; Csernoch et al., 2004). In addition, our study found that after plasma treatment, intracellular Ca2+ levels significantly increased, whereas the mRNA expression level of PLC, a signal that regulates the release of intracellular Ca2+ stores, did not change significantly. Therefore, we speculated that plasma treatment could trigger the opening of Ca2+ channels in the cell membrane by inducing membrane depolarization, leading to an influx of extracellular Ca2+. The Ca2+ influx system in fungal cell membranes is primarily composed of Cch1p, Mid1p, and Ecm7 (Lange & Peiter, 2019). When the mid-1 mutant strain (Ca2+ channel deletion) was treated with plasma, its ability to produce cellulase did not increase. Similarly, when cell membrane Ca2+ channel blockers (LaCl3) were added, the promoting effect of plasma on fungal cellulase production disappeared. This suggests that plasma promotes the production of fungal cellulases by increasing the influx of Ca2+ through channels on the cell membrane. Ca2+ is an important signaling molecule in the production of fungal cellulase that promotes the transcription of cellulase genes through the calmodulin-crz1 signaling pathway and plays an active regulatory role in fungal vesicle transport and secretion (Li et al., 2022; Randhawa et al., 2024). The transport and secretion of vesicles containing enzyme proteins is the last step in the protein secretory pathway. Therefore, effect of plasma on Ca2+ influx should be further analyzed because enzyme secretion is another bottleneck that needs to be overcome for efficient production. In addition to ion channels, membrane transporters for sugars such as cellobiose, an inducer of cellulase expression, can be more actively opened by plasma, which accelerates the induction of cellulase production. Further analysis of this is also needed to elucidate the mechanisms.
The increase in intracellular NO levels after the plasma treatment observed in our study may also have played a role in promoting cellulase production. NO is an important regulatory molecule in the process of plasma-induced cellulase production. Intracellular NO participates in the regulatory network of cellulolytic enzyme production by regulating cAMP and MAPK (Yu et al., 2023). Several studies have shown that intracellular NO levels are elevated by nitrite-dependent NO production, nitric oxide synthase (NOS)-dependent NO production, and free diffusion of extracellular NO (Andrabi et al., 2023; Liu et al., 2002; Neill et al., 2003). In nitrite-dependent NO production, NO3− in the media is taken up by the cell through the transporter and is assimilated into NH3, and NO can be produced as an intermediate during this process. In our study, the mRNA expression levels of genes involved in nitrite-dependent NO production, such as nitrate transporter (nit-10), nitrate reductase (nit-3), and nitrite reductase (nit-6), did not change significantly after plasma treatment. This suggests that plasma may increase intracellular NO level through nitric oxide synthase (NOS)-dependent NO production or free diffusion of extracellular NO. However, these conjectures require further verification, which will be the focus of future research. Interestingly, we observed that intracellular Ca2+ appeared to regulate the NO levels in fungal cells during plasma-induced cellulase production. Several studies have reported the crosstalk between Ca2+ and NO (Besson-Bard et al., 2008; Jeandroz et al., 2013). In Ganoderma lucidum, the interaction between Ca2+ and NO regulates the gibberellic acid biosynthesis of ganoderma acid under heat stress (Liu et al., 2018). Our results suggest that plasma accelerates Ca2+ influx into fungal cells, leading to NO generation. This hypothesis should be examined in future studies.
Our data demonstrates that there may be a range of plasma dose activating enzyme production. However, a standard unit for the plasma dose has not been established, but the plasma energy (electric power × treatment time) applied to the sample has been frequently used as the plasma dose. Our results indicate that the upper limit of plasma energy for the promotion of enzyme production is 500–600 J, regardless of the plasma source type and feeding gases. With the same plasma energy, treatment with high-electric-power jet plasma for a short time appears to be more efficient for enzyme production. This indicates that the plasma treatment method (plasma type and a combination of high-power and short-term treatment) is also critical for improving the efficiency of enzyme production. Our data also suggests that jet plasma can be used to enhance the large-scale production of cellulases. Although a maximum 20% enhancement in enzyme production was obtained, the electric power of the plasma source and the treatment time should be optimized.
In this study, we provide experimental evidence demonstrating the plasma-mediated enhancement of fungal enzyme production. Further investigation is required to determine whether plasma affects intracellular expression or extracellular secretion of enzymes. The promoting effect of plasma on enzyme production was observed when the plasma energy was below 600 J, indicating that plasma can exert a double-edged effect, ranging from activation to inactivation. However, the combination of plasma source type, electric power, and treatment duration can generate different outcomes, even under the same plasma energy. Plasma treatment can cause cell membrane depolarization, affect molecular transport, and elevate intracellular levels of secondary signaling molecules such as Ca2+ and NO. These results provide insight into the mechanisms of plasma-mediated enhancement of enzyme production. This non-mutagenic approach may be genetically and environmentally safe for large-scale fungal enzyme production and can be applied to bioreactors. However, establishing optimal conditions for plasma treatment is essential for the future application prospects of plasma.
Availability of data and materials
The datasets used and/or analysed during the current study are available from the corresponding author on reasonable request.
Declaration of competing interest
The authors declare no conflict of interest.
Funding
This research was supported by the National Research Foundation of Korea (NRF) (RS-2021-NR060112, 2020R1F1A1070942) and partly by a research grant from Kwangwoon University in 2024.
Authors’ contributions
Nan-Nan Yu: Conceptualization, Methodology, Formal analysis, Investigation, Writing-original draft. Wirinthip Ketya: Methodology, Investigation. Kirubel Amsalu: Methodology, Formal analysis, Investigation. Jun-Sup Lim: Investigation, Resources. Hu-Nan Sun: Conceptualization, Formal analysis, Writing-review & editing. Eun-Ha Choi: Conceptualization, Resources, Writing-review & editing, Funding acquisition. Gyungsoon Park: Conceptualization, Writing-original draft, Writing-review & editing, Supervision, Project administration, Funding acquisition
Acknowledgements
We thank the Fungal Genetics Stock Center (Manhattan, KS, USA) for providing wild-type and mutant strains of N. crassa. We would like to thank Editage (www.editage.co.kr) for English language editing.
- Abolore, R.S., Jaiswal, S., Jaiswal, A.K. 2025. A comprehensive review of the application of cold plasma technology in lignocellulosic biomass pretreatment. Biofuels, Bioprod Biorefin, 19(2), 453-468.
- Andrabi, S.M., Sharma, N.S., Karan, A., Shahriar, S.M.S., Cordon, B., Ma, B., Xie, J. 2023. Nitric Oxide: Physiological Functions, Delivery, and Biomedical Applications. Adv Sci (Weinh), 10(30), e2303259.
- Bender, D., Schwarz, G. 2018. Nitrite-dependent nitric oxide synthesis by molybdenum enzymes. FEBS Lett, 592(12), 2126-2139.
- Besson-Bard, A., Courtois, C., Gauthier, A., Dahan, J., Dobrowolska, G., Jeandroz, S., Pugin, A., Wendehenne, D. 2008. Nitric oxide in plants: production and cross-talk with Ca2+ signaling. Mol Plant, 1(2), 218-28.
- Catterall, W.A. 2011. Voltage-gated calcium channels. Cold Spring Harb Perspect Biol, 3(8), a003947.
- Chapman, J., Ismail, A.E., Dinu, C.Z. 2018. Industrial applications of enzymes: Recent advances, techniques, and outlooks. Catalysts, 8(6), 238.
- Chen, P., Li, P., Dou, D., Yang, J., Liu, D., Qu, M. 2025. Plasma-activated water boosts the activity of lytic polysaccharide monooxygenase and the conversion of chitin by a chitinolytic enzyme cocktail. J Agric Food Chem, 73(6), 3569-3579.
- Coradetti, S.T., Xiong, Y., Glass, N.L. 2013. Analysis of a conserved cellulase transcriptional regulator reveals inducer-independent production of cellulolytic enzymes in Neurospora crassa. Microbiologyopen, 2(4), 595-609.
- Csernoch, L., Zhou, J., Stern, M.D., Brum, G., Rios, E. 2004. The elementary events of Ca2+ release elicited by membrane depolarization in mammalian muscle. J Physiol, 557(Pt 1), 43-58.
- Dadwal, A., Sharma, S., Satyanarayana, T. 2020. Progress in ameliorating beneficial characteristics of microbial cellulases by genetic engineering approaches for cellulose saccharification. Front Microbiol, 11, 1387.
- Deckers, M., Deforce, D., Fraiture, M.A., Roosens, N.H.C. 2020. Genetically modified microorganisms for industrial food enzyme production: An overview. Foods, 9(3), 326.
- Dirks, T., Stoesser, D., Schüttler, S., Hollmann, F., Golda, J., Bandow, J.E. 2025. The atmospheric pressure capillary plasma jet is well-suited to supply H2O2 for plasma-driven biocatalysis. bioRxiv, 2025.01.07.631711.
- Durickovic, I. 2016. Using Raman spectroscopy for characterization of aqueous media and quantification of species in aqueous solution, in: Stauffer, M.T. (Ed.), Applications of Molecular Spectroscopy to Current Research in the Chemical and Biological Sciences. IntechOpen Limited, London, pp. e27.
- Ekezie, F.G.C., Sun, D.W., Cheng, J.H. 2017. A review on recent advances in cold plasma technology for the food industry: Current applications and future trends. Trends Food Sci Technol, 69, 46-58.
- Farasat, M., Arjmand, S., Ranaei Siadat, S.O., Sefidbakht, Y., Ghomi, H. 2018. The effect of non-thermal atmospheric plasma on the production and activity of recombinant phytase enzyme. Sci Rep, 8(1), 16647.
- Flannery, M.R. 1983. The plasma state: physics of ion-ion and electron-ion collisions. Science, 222(4626), 922.
- Gurung, N., Ray, S., Bose, S., Rai, V. 2013. A Broader View: Microbial Enzymes and Their Relevance in Industries, Medicine, and Beyond. Biomed Res Int, 2013, 329121
- Hanniet, Q., Mateos, C., Onillon, L., Maccow, A., Gefflaut, T., Hall, M., Reiter, T., Bordeaux, M., Brun, N., Drone, J. 2025. Innovative carrier materials for advancing enzyme immobilization in industrial biocatalysis. Comptes Rendus. Chimie, 28(G1), 543-559.
- Jeandroz, S., Lamotte, O., Astier, J., Rasul, S., Trapet, P., Besson-Bard, A., Bourque, S., Nicolas-Frances, V., Ma, W., Berkowitz, G.A., Wendehenne, D. 2013. There's more to the picture than meets the eye: nitric oxide cross talk with Ca2+ signaling. Plant Physiol, 163(2), 459-470.
- Ji, S.H., Kim, J.S., Lee, C.H., Seo, H.S., Chun, S.C., Oh, J., Choi, E.H., Park, G. 2019. Enhancement of vitality and activity of a plant growth-promoting bacteria (PGPB) by atmospheric pressure non-thermal plasma. Sci Rep, 9, 1044.
- Kabarkouhi, Z., Tadi, S.H., Mahmoodi, H., Ranaei Siadat, S.O., Arjmand, S., Shokri, B. 2024. Simulation and experimental study of a cold atmospheric pressure plasma and comparison of efficiency in boosting recombinant Endoglucanase II production in Pichia pastoris. PLOS ONE, 19(5), e0303795.
- Kant Bhatia, S., Vivek, N., Kumar, V., Chandel, N., Thakur, M., Kumar, D., Yang, Y.H., Pugazendhi, A., Kumar, G. 2021. Molecular biology interventions for activity improvement and production of industrial enzymes. Bioresour Technol, 324, 124596.
- Kawase, M., Chen, W., Kawaguchi, K., Nyasha, M.R., Sasaki, S., Hatakeyama, H., Kaneko, T., Kanzaki, M. 2020. TRPA1 and TRPV1 channels participate in atmospheric-pressure plasma-induced [Ca2+]i response. Sci Rep, 10(1), 9687.
- Lange, M., Peiter, E. 2019. Calcium transport proteins in fungi: The phylogenetic diversity of their relevance for growth, virulence, and stress resistance. Front Microbiol, 10, 3100.
- Langmuir, I. 1928. Oscillations in ionized gases. Proc Natl Acad Sci U S A, 14(8), 627-37.
- Li, N., Zeng, Y., Chen, Y., Shen, Y., Wang, W. 2022. Induction of cellulase production by Sr2+ in Trichoderma reesei via calcium signaling transduction. Bioresour Bioprocess, 9(1), 96.
- Li, S., Yang, X., Yang, S., Zhu, M., Wang, X. 2012. Technology prospecting on enzymes: application, marketing and engineering. Comput Struct Biotechnol J, 2, e201209017.
- Li, Y.-H., Juo, J.-J., Ng, I.S. 2025. Current breakthroughs and advances in atmospheric room temperature plasma (ARTP) technology for biomanufacturing. Bioresour Bioprocess, 12(1), 63.
- Li, Y., Ho Kang, M., Sup Uhm, H., Joon Lee, G., Ha Choi, E., Han, I. 2017. Effects of atmospheric-pressure non-thermal bio-compatible plasma and plasma activated nitric oxide water on cervical cancer cells. Sci Rep, 7, 45781.
- Liu, R., Shi, L., Zhu, T., Yang, T., Ren, A., Zhu, J., Zhao, M.W. 2018. Cross talk between nitric oxide and calcium-calmodulin regulates ganoderic acid biosynthesis in Ganoderma lucidum under heat stress. Appl Environ Microbiol, 84(10), e00043-18.
- Liu, S., Hou, Y., Liu, W., Lu, C., Wang, W., Sun, S. 2015. Components of the calcium-calcineurin signaling pathway in fungal cells and their potential as antifungal targets. Eukaryot Cell, 14(4), 324-334.
- Liu, X.P., Samouilov, A., Lancaster, J.R., Zweier, J.L. 2002. Nitric oxide uptake by erythrocytes is primarily limited by extracellular diffusion not membrane resistance. J Biol Chem, 277(29), 26194-26199.
- Livak, K.J., Schmittgen, T.D. 2001. Analysis of relative gene expression data using real-time quantitative PCR and the 2(-Delta Delta C(T)) Method. Methods, 25(4), 402-408.
- Maghraby, Y.R., El-Shabasy, R.M., Ibrahim, A.H., Azzazy, H.M.E. 2023. Enzyme immobilization technologies and industrial applications. ACS Omega, 8(6), 5184-5196.
- Marcos, A.T., Ramos, M.S., Marcos, J.F., Carmona, L., Strauss, J., Cánovas, D. 2016. Nitric oxide synthesis by nitrate reductase is regulated during development in Aspergillus. Mol Microbiol, 99(1), 15-33.
- Mokrani, S., Nabti, E.H., Mokrani, S., Nabti, E.H. 2024. Recent status in production, biotechnological applications, commercial aspects, and future prospects of microbial enzymes: A comprehensive review. Int J Agric Sci Food Technol, 10, 006-020.
- Muller, E.M., Locke, E.G., Cunningham, K.W. 2001. Differential regulation of two Ca2+ influx systems by pheromone signaling in Saccharomyces cerevisiae. Genetics, 159(4), 1527-1538.
- Neill, S.J., Desikan, R., Hancock, J.T. 2003. Nitric oxide signalling in plants. New Phytol, 159(1), 11-35.
- Noothalapati, H., Sasaki, T., Kaino, T., Kawamukai, M., Ando, M., Hamaguchi, H.O., Yamamoto, T. 2016. Label-free chemical imaging of fungal spore walls by Raman microscopy and multivariate curve resolution analysis. Sci Rep, 6, 27789.
- Oguntimein, G., Vlach, D., Moo-Young, M. 1992. Production of cellulolytic enzymes by Neurospora sitophila grown on cellulosic materials. Bioresour Technol, 39(3), 277-283.
- Phillips, C.M., Iavarone, A.T., Marletta, M.A. 2011. Quantitative proteomic approach for cellulose degradation by Neurospora crassa. J Proteome Res, 10(9), 4177-4185.
- Qiao, E., Zheng, H. 2005. Raman scattering spectroscopic study of n-pentane under high pressure. Appl Spectrosc, 59(5), 650-653.
- Randhawa, A., O, A.O., Jawed, K., Yazdani, S.S. 2024. Calcium signaling positively regulates cellulase translation and secretion in a Clr-2-overexpressing, catabolically derepressed strain of Penicillium funiculosum. Biotechnol Biofuels Bioprod, 17(1), 21.
- Suto, M., Tomita, F. 2001. Induction and catabolite repression mechanisms of cellulase in fungi. J Biosci Bioeng, 92(4), 305-311.
- Tonks, L. 1967. The Birth of “Plasma”. Am J Phys, 35(9), 857-858.
- Veerana, M., Mitra, S., Ki, S.H., Kim, S.M., Choi, E.H., Lee, T., Park, G. 2021. Plasma-mediated enhancement of enzyme secretion in Aspergillus oryzae. Microb Biotechnol, 14(1), 262-276.
- Wapshott-Stehli, H.L., Myers, B.G., Herrera Quesada, M.J., Grunden, A., Stapelmann, K. 2022. Plasma-driven biocatalysis: In situ hydrogen peroxide production with an atmospheric pressure plasma jet increases the performance of OleTJE when compared to adding the same molar amount of hydrogen peroxide in bolus. Plasma Process Polym, 19(5), 2100160.
- Waters, J.C., Nixon, A., Dwyer, M., Biffinger, J.C., Lee, K. 2017. Developing elite Neurospora crassa strains for cellulosic ethanol production using fungal breeding. J Ind Microbiol Biotechnol, 44(8), 1137-1144.
- Yan, S., Xu, Y., Yu, X.W. 2021. From induction to secretion: a complicated route for cellulase production in Trichoderma reesei. Bioresour Bioprocess, 8(1), 107.
- Yayci, A., Dirks, T., Kogelheide, F., Alcalde, M., Hollmann, F., Awakowicz, P., Bandow, J.E. 2020. Microscale atmospheric pressure plasma jet as a source for plasma-driven biocatalysis. Chem Cat Chem, 12(23), 5893-5897.
- Yu, N.N., Ketya, W., Choi, E.H., Park, G. 2022. Plasma promotes fungal cellulase production by regulating the levels of intracellular NO and Ca2+. Int J Mol Sci, 23(12), 6668.
- Yu, N.N., Ketya, W., Park, G. 2023. Intracellular nitric oxide and cAMP are involved in cellulolytic enzyme production in Neurospora crassa. Int J Mol Sci, 24(5), 4503.
- Zhang, X., Zhang, X.-F., Li, H.-P., Wang, L.-Y., Zhang, C., Xing, X.-H., Bao, C.-Y. 2014. Atmospheric and room temperature plasma (ARTP) as a new powerful mutagenesis tool. Appl Microbiol Biotechnol, 98(12), 5387-5396.