Strains and Media
B. licheniformis and B. natto were purchased from the Microbial Species Preservation and Management Center of the Institute of Microbiology, Chinese Academy of Sciences (Tianjin, China), and preserved by the Microbial Technology Research Laboratory of the College of Chemical Engineering, Nanjing Forestry University. The Ginkgo biloba leaves were sourced from Ginkgo Gardens in Pizhou, Jiangsu Province, China. Soybean meal and wheat bran were commercially purchased in Nanjing, China.
Culture medium for strains: 0.5% beef extract, 1.0% peptone, and 0.5% sodium chloride by mass. For solid culture medium, 2.0% agar by mass was added.
Fermentation medium: consisting of Ginkgo biloba leaf powder, soybean meal, and wheat bran in a mass ratio of 14:3:3. After thorough mixing, nutrient salts were added (1.50% glucose, 0.30% dipotassium phosphate, 0.05% magnesium sulfate heptahydrate, and 1.50% peptone by mass). The Ginkgo biloba leaves were naturally air-dried, crushed, and sieved through a 60-mesh sieve for use.
Experimental animals
300 AA broiler chickens (1-day-old healthy) of the same batch and genetic background were selected and purchased from Shandong Yantai Sujiali Poultry Industry Co., Ltd. (Shandong, China) with an average body weight of 50.00 ± 3.56 g, and the difference was not significant (P > 0.05).
Experimental instruments and equipment
D-1 Auto Clave automatic high-temperature and high-pressure steam sterilizer (Beijing Fanke Trade Co., Ltd., China); 5415R benchtop high-speed refrigerated centrifuge (Eppendorf, Germany); ZHWY-2102C shaker (Shanghai Zhicheng Analytical Instrument Manufacturing Co., Ltd., China); MH-350 constant temperature and humidity light incubator (Panasonic, Japan); SpectraMax190 full-wavelength microplate reader (Molecular Devices, USA); 65 µm PDMS/DVB solid-phase microextraction (SPME) fiber and 15 mL SPME vial (Nanjing Dahu Science and Technology Co., Ltd., China); Salter shear force tester (GR, USA); CHROMA METER CR-400 colorimeter (Konica Minolta, Japan).
Experimental Methods
Orthogonal experiment for optimizing fermentation medium
A loop of Bacillus was picked from the slant culture medium and inoculated into 50 mL of sterile seed culture medium, and cultured at 37°C with shaking at 180 r/min for 24 h. Using viable cell count and protease activity as indicators, and with B. licheniformis and B. natto as the strains, the fermentation conditions such as carbon source, nitrogen source, inoculum size, solid-to-liquid ratio, initial pH, fermentation time, and fermentation temperature were studied.
Viable cell and spore counting
One gram of fermented sample was weighed and placed in 20 mL of sterile physiological saline. It was oscillated at 37°C and 180 r/min for 30 min to disperse it uniformly. The dispersed sample was then serially diluted, and 0.2 mL of an appropriate dilution was spread onto sterile beef extract-peptone agar plates. 3 parallel samples were set up and cultured upside down at 37°C for 24 h, followed by colony counting. The dispersed sample was placed in an oven at 80°C for 15 min. Then, 0.2 mL of appropriately diluted solution was spread onto sterile beef extract-peptone solid culture medium. 3 parallel samples were set up and cultured upside down at 37°C for 24 h, followed by spore counting.
Enzyme extraction and protease activity assay
One gram of air-dried fermented sample was weighed and placed in 20 mL of sterile physiological saline. It was oscillated at 37°C and 200 r/min for 30 min. The suspension was then filtered to obtain the crude enzyme extract. The protease activity was assayed according to the Chinese national professional standard SB/T 10317 − 1999 "Method for Determination of Protease Activity".
Detection of aroma compound content
A certain amount of air-dried Ginkgo biloba leaf fermentate was placed in a 15 mL SPME vial. A 65µm PDMS/DVB SPME fiber was inserted from the top of the vial, and after extraction for a certain period, gas chromatography-mass spectrometry (GC-MS) analysis was performed. Chromatographic conditions were as follows: injector temperature of 250°C; oven temperature program: held at 40°C for 1 min, increased to 64°C at a rate of 2°C/min, then increased to 160°C at a rate of 3°C/min, further increased to 250°C at a rate of 10°C/min, and held for 5 min; carrier gas: 99.99% high-purity helium, carrier gas flow rate: 1 mL/min; chromatographic column: TR-5MS capillary column. Mass spectrometry conditions: EI ion source, temperature of 250°C, ionization voltage of 70 eV, interface temperature of 250°C, quadrupole temperature of 150°C [21].
Extraction and detection method of Ginkgo flavone content
5 grams of fermented sample were taken, and 70% volume fraction ethanol was used as the extraction solvent. Under the condition of a solid-to-liquid ratio of 1:30 (g:mL), ultrasonic extraction was performed for 30 min. The extract was filtered to obtain the sample solution for analysis. A 5 mL aliquot of the sample solution was accurately pipetted into a 10 mL stoppered test tube, with distilled water used as a blank control. To each tube, 0.3 mL of 5% sodium nitrite solution was added, allowed to stand for 6 min, then 0.3 mL of 10% aluminum nitrate solution was added, allowed to stand for another 6 min, followed by the addition of 4 mL of 4% sodium hydroxide, and the volume was adjusted to 10 mL with distilled water. After standing for 15–20 min, the absorbance at A510 was measured. The flavonoid content was calculated using the standard curve equation: A = 8.0581C − 0.0012 (R² = 0.9995), where A is the absorbance at 510 nm and C is the rutin mass concentration.
Detection of crude protein and amino acid content
The crude protein and amino acid content in the fermented samples were determined according to GB/T 6432 − 1994 "Method for Determination of Crude Protein in Feeds" and GB/T 18246 − 2000 "Method for Determination of Amino Acids in Feeds".
Experimental animal handling and feed design
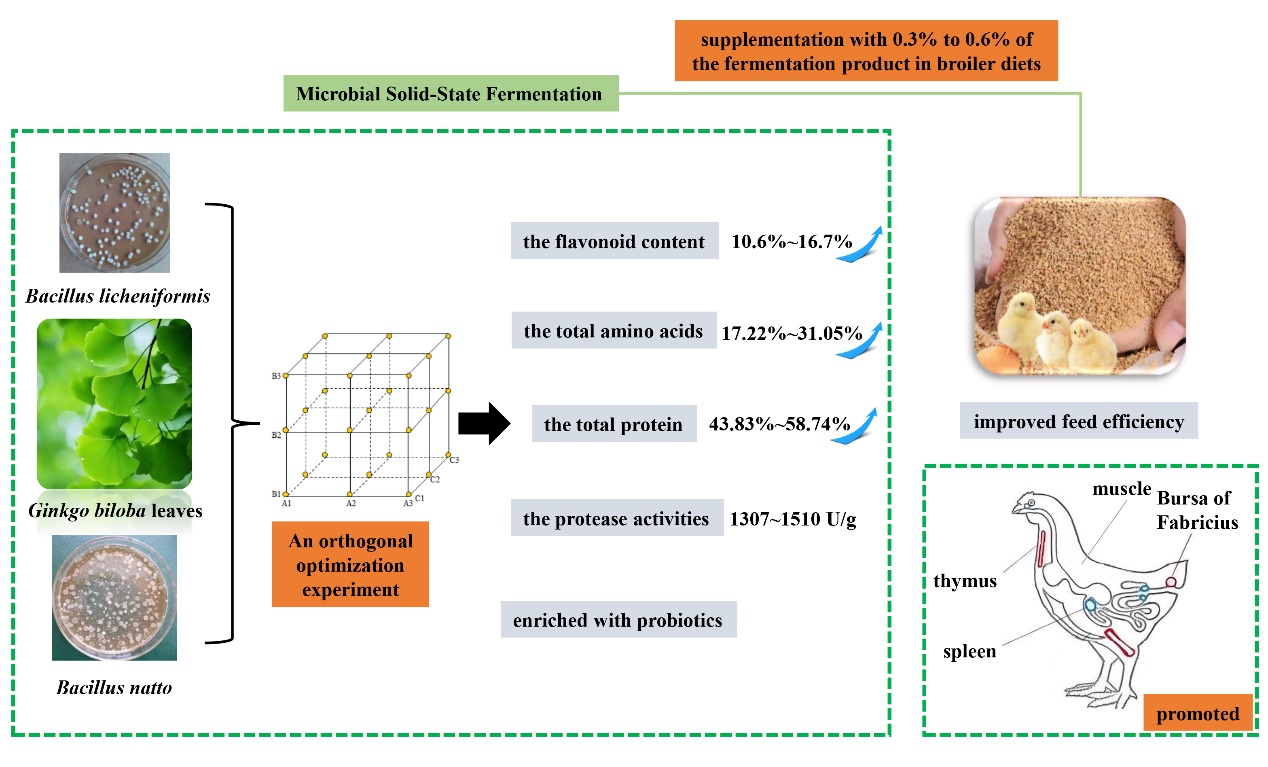
The 300 1-day-old healthy AA broiler chickens were randomly divided into 5 treatment groups: a control group fed a basic diet, a 0.3% B. licheniformis-fermented Ginkgo biloba leaf group (0.3% BL group), a 0.6% B. licheniformis-fermented Ginkgo biloba leaf group (0.6% BL group), a 0.3% B. natto-fermented Ginkgo biloba leaf group (0.3% BN group), and a 0.6% B. natto-fermented Ginkgo biloba leaf group (0.6% BN group). The experiment lasted for 42 days, with each treatment group comprising 6 replicates of 10 chickens each. A corn-soybean meal-based basic diet was used, and the experiment employed a weight substitution method. In the treatment groups, Ginkgo biloba leaf fermentate was added by replacing an equivalent amount of wheat bran. The diet composition and nutritional levels are shown in Table 1. The chickens were housed in cages with ad libitum access to feed and water. The room temperature was initially maintained at 34–36°C for the first 14 days and then gradually lowered to around 26°C. The lighting schedule was initially 24 h and gradually reduced to 12 h per day.
Measurement indicators and methods for experimental animals
Production performance: Daily feed consumption was recorded. Chickens were weighed on days 1, 21, and 42 after overnight fasting. Average daily feed intake (FI), average daily gain (BWG), and feed conversion ratio (F/G) were calculated.
Serum biochemical indicators: On day 42, six chickens (3 males and 3 females) were randomly selected from each treatment group. Blood samples were collected from the jugular vein and centrifuged at 4500 r/min for 15 min at 4°C to obtain serum. Serum samples were stored at -80°C until analysis. Total protein and albumin were measured using commercial kits (Nanjing Jiancheng Bioengineering Institute). α-tocopherol (α-TOH) content was determined using an enzyme method with a standard curve [22].
Antioxidant indicators in breast muscle: A 0.5 g sample of breast muscle tissue, free of fat and connective tissue, was homogenized with 4.5 mL of pre-cooled physiological saline in an ice bath for 1–2 min. The homogenate was centrifuged at 4500 r/min for 15 min at 4°C, and the supernatant was stored at -20°C for subsequent analysis of muscle antioxidant function and fatty acid composition. Malondialdehyde (MDA) content in serum and liver was measured using the thiobarbituric acid method [23]. Glutathione peroxidase (GSH-Px) activity was determined according to Noguchi et al [24]. Total superoxide dismutase (T-SOD) activity was assessed using the xanthine oxidase method, and total antioxidant capacity (T-AOC) was evaluated using the Fe³⁺ reduction method..
Breast muscle pH and water-holding capacity: One side of the breast muscle was quickly excised and placed on ice. The muscle pH was measured at 45 min and 24 h post-mortem after homogenizing in a mixture of 5 mmol/L iodoacetic acid and 150 mmol/L potassium chloride. For drip loss measurement, a 10 g sample of breast muscle was suspended in a 4°C refrigerator, weighed (W₁), sealed to prevent evaporation, and reweighed after 24 h (W₂) and 48 h (W₃). Drip loss was calculated as follows:
24-h drip loss rate = (W1 - W2) / W1 × 100% (1)
48-h drip loss rate = (W1 - W3) / W1 × 100% (2)
Cooking loss and shear force: Ten-gram samples of breast and leg muscle were wrapped in aluminum foil and cooked in a 75°C water bath for 15 min. The samples were then weighed to determine cooking loss. For shear force measurement, breast muscle samples were sealed in plastic bags and heated in an 80°C water bath until the core temperature reached 74°C. After cooling to room temperature, each sample was cut into 3–5 strips (1 cm × 1 cm × 3 cm, length × width × thickness) parallel to the muscle fibers. Shear force was measured three times using a shear force tester, and the average value was recorded.
Color measurement: Samples of breast muscle (2 cm × 2 cm × 2 cm, length × width × thickness) were prepared, and a colorimeter was used to record the lightness (L), redness (a), and yellowness (b*) values of both breast and leg muscles.
Fatty acid composition of breast muscle: A 0.2 g sample of freeze-dried breast muscle was combined with 1 mL of internal standard and 4 mL of NaOCH3/methanol. The mixture was incubated at 50°C for 20 min, followed by the addition of 2 mL of hydrochloric acid/methanol solution and incubation at 80°C for 1 h. After cooling to room temperature, 2 mL of water and 6 mL of hexane were added, and the mixture was vigorously shaken and allowed to separate. A 200 µL aliquot of the upper layer was combined with 600 µL of hexane for GC analysis. GC conditions were as follows: column: 0.22 mm inner diameter, 30 m length; column temperature: 195°C; carrier gas: nitrogen at 9 mL/min; injector temperature: 250°C; hydrogen flow rate: 22.5 mL/min; air flow rate: 80 mL/min; split ratio: 60:1; injection volume: 0.5-1 µL.
Total fatty acids (mg/g) = (total peak volume - internal standard volume) / internal standard volume × (mass of internal standard) (3)
Statistical Analysis
Data were organized using Excel and subjected to one-way Analysis of Variance (ANOVA) using SPSS 6.0. When significant differences were observed, multiple comparisons were performed using Duncan’s method. The significance level was set at P < 0.05. All results are presented as mean values.