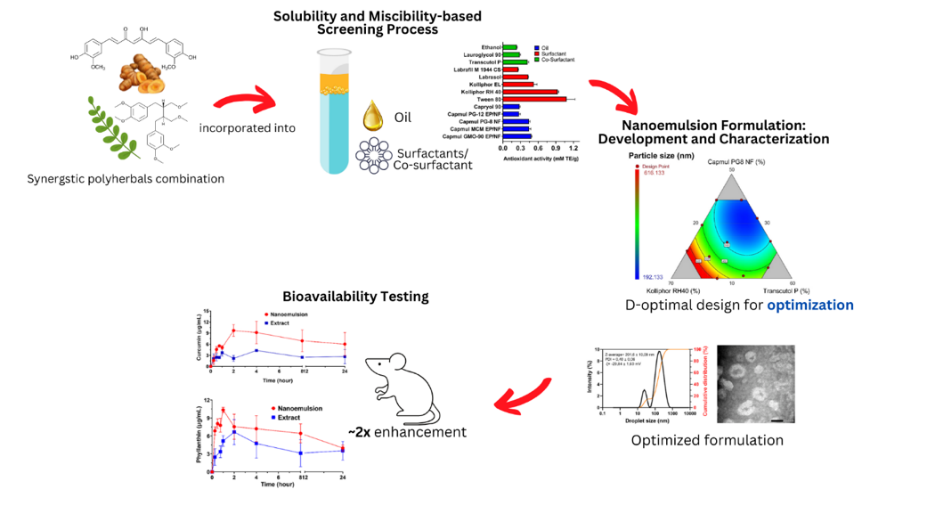
Polyherbal combination has been reported due to synergistic effects between Phyllanthus niruri, Centella asiatica, Curcuma xanthorrhiza, and Curcuma longa. The solubility and permeability limit the activity of those pharmacological bioactive compounds, and it improves dramatically when the absorption problem has been tackled accurately through nanoemulsion. This recent study purposed to develop a self-nanoemulsion formulation of polyherbal combination and improve the bioavailability of active pharmacological compounds. The nanoemulsion components, including oil, surfactant, and co-surfactant, were developed using an integrated statistical method, categorical model factorial design, and D-optimal design for screening and formulation development, respectively. The optimized formulation was determined based on the parameters of the self-emulsification process, droplet size and variation, zeta potential, antioxidant activity, and drug loading. The pharmacokinetics evaluation of the optimized formulation was carried out. The results revealed that modified oil reduced the droplet size and its variation. The surfactant improved the antioxidant activity, and the co-surfactant enhanced the stability of the nanoemulsion. The optimized formulation for a nanoemulsion combination of polyherbal extracts was obtained at 29.08% Capmul PG 8 NF, 35.52% Kolliphor RH 40, and 35.41% Transcutol P. The bioavailability of curcumin and phyllanthin as the main compounds in the polyherbal combination increased nearly 2 times in all pharmacokinetics parameters. This concept could be applied for bioactivity improvement through the bioavailability enhancement of the polyherbal combination via self-nanoemulsion formulation.
Research Article
Self-nanoemulsion containing synergistic polyherbal combinations: DoE-based formulation development and pharmacokinetics study
https://doi.org/10.21203/rs.3.rs-8052759/v1
This work is licensed under a CC BY 4.0 License
You are reading this latest preprint version
self nanoemulsion
polyherbal
antioxidant
surfactant
bioavailability
Many herbal plants have been reported to have antioxidant and immunostimulant properties, for instance, Phyllanthus niruri, Centella asiatica, Curcuma xanthorrhiza, and Curcuma longa [1–3]. The combination of Phyllanthus niruri, Centella asiatica, Curcuma xanthorrhiza, and Curcuma longa had the most optimized antioxidant and immunostimulant activity and worked synergistically both in-vivo and in-vitro [1]. The crucial part of the bioactive compounds in these polyherbals faced big problems with solubility and permeability; hence, the bioavailability and bioactivity reduced dramatically. For instance, curcumin (Curcuma xanthorrhiza and Curcuma longa) and phyllanthin (Phyllanthus niruri) have poor solubility [4–6]. On the other hand, absorption problems related to transport issues are present in a bulky molecular structure, for example, a triterpenoid glycoside (asiaticoside) in Centella asiatica with adequate solubility. However, it is limited in permeability due to its considerable molecular weight (959.12 g/mol) [7]. In addition, the phenolic compounds contained in Phyllanthus niruri, Centella asiatica, Curcuma xanthorrhiza, and Curcuma longa play a fundamental role in antioxidant activity; however, they are susceptible to efflux transporter, poly-glycoprotein [8]. These issues are the biggest obstacles to achieving adequate bioactivity and synergistic effects that elevate efficacy. Therefore, alteration of the delivery of bioactive compounds is a crucial step to improve the bioavailability of the bioactive compound in the polyherbal combinations [9].
Among the nano-delivery approaches, nanoemulsion is feasible in manufacturing due to low energy requirements [10], particularly self-emulsification. It produces spontaneous nanoemulsions when the formulation is introduced into the medium. In addition, it is easier to scale up since the essential performance depends on the formulation composition [11], along with excellent physical and chemical stability [12]. Self-nano emulsifying drug delivery system (SNEDDS) is a homogeneous system consisting of an isotropic mixture of oil, surfactant, and co-surfactant, which produces self and spontaneous formation of nanodroplet using diffusion energy from surfactant [13, 14]. The oil phase is a core nanoemulsion component that dissolves lipophilic drugs and increases transport through the intestinal lymphatic system [15]. The oil phase has a role in changing the drug transport route to the lymphatic pathway and avoiding first-pass metabolism, and it is effective for bioavailability enhancement [16]. The surfactant in the system is intended to reduce the interfacial tension between the oil and water phases to produce ultrafine and stable oily droplets [17]. The single-use of surfactants is restricted to reduce interfacial tension optimally; therefore, co-surfactants are applied to this system. The combination of both works synergistically to increase the dispersibility of the surfactant in the oil phase and produce smaller droplet sizes, thereby increasing the stability and homogeneity of the nanoemulsion [17–21]. Meanwhile, co-surfactants are also applied to enhance drug loading in the oil phase, increase the self-emulsification process, and modulate the size of nanoemulsion droplets [15, 22]. The critical performance of the nanoemulsion depends on the proportions of the oil, surfactant, and co-surfactant because it utilizes the internal energy to form the nanodroplet [10, 23]. Several studies have reported that different active ingredients interacted specifically with oil, surfactant, and co-surfactant to produce nanoemulsion [24–26]. Therefore, the combination of purified polyherbal extracts requires appropriate proportions of oil, surfactant, and co-surfactant phases to produce ideal nanoemulsion characteristics.
The formation of isotropic mixtures and finding the optimized proportion of nanoemulsion components are complex to understand [25, 27]. When a conventional trial error-based technique is applied, it is limited by scientific justification and time-consuming. The implementation of design of experiment (DoE), a part of quality by design, helps reduce the number of runs without losing essential information, for example, data patterns and main effects [20, 28, 29] because it is a structured and systematic method for determining the relationship between factors that influence a process and the output of that process. Therefore, this concept can be implemented in the formulation development of nanoemulsion containing a combination of polyherbals. This present work aimed to develop the self and spontaneous nanoemulsion formulation containing a polyherbal combination through an integrated statistical approach, followed by a pharmacokinetics proof of concept study.
Materials
The dried plants of Phyllanthus niruri, Centella asiatica, Curcuma xanthorrhiza, and Curcuma longa were obtained from the Research and Development Center for Medicinal Plants and Traditional Medicine (B2P2TO2T; Tawangmangu, Indonesia). The extraction solvents, namely, n-hexane and ethanol, were purchased from Merck (Darmstadt, Germany). The nanoemulsion components were oleic acid and Tween 80 obtained from Sigma Aldrich (St.Louis, MO); Capryol 90, Lauroglycol 90, Labrasol, Labrafil M 1944 CS, Transcutol P, Labrafac Lipophile WL 1349 and Geloil SC were obtained from Gattefosse (Saint-Priest, France); and Capmul PG-12 EP/NF, Capmul PG-8 NF, Capmul MCM EP/NF, Capmul MCM C8 EP/NF, Capmul GMO-90 EP/NF were obtained from ABITEC (Columbus, Ohio). Kolliphor EL and Kolliphor RH 40 were obtained from BASF (Ludwigshafen, Germany). Materials for the antioxidant activity assay included 2,2-diphenyl-1- picrylhydrazyl (DPPH), methanol, and 6-hydroxy-2,5,7,8- tetramethylchroman-2-carboxylic acid (Trolox) purchased from Sigma Aldrich (St. Louis, MO). Curcumin (99%, HPLC) and asiaticoside (98%, HPLC) reference standards were obtained from PT. Andalas Sitawa Fitolab (Padang, Indonesia), and phyllanthin (HPLC 98%) was purchased from ChromaDex (Los Angeles, CA). The animal subjects, male Wistar rats, were obtained from Universitas Sebelas Maret Integrated Laboratory. Water for high-performance liquid chromatography (HPLC), acetonitrile, formic acid, and methanol for HPLC was obtained from Merck (Darmstadt, Germany).
Screening of nanoemulsion components
The screening process used a solubility assay to obtain the best oil, surfactant, and co-surfactant components based on the antioxidant activity. An excess polyherbal extract (100 mg; the combination according to the previously reported work [1]) was added to 0.5 mL of each oil, surfactant, and co-surfactant. Each mixture was sonicated for 30 min, followed by stirring for 48 hours. The mixture was centrifuged at 10,000 rpm for 5 min to separate the undissolved extract. The solubility of the extract components in the vehicle was analyzed based on antioxidant activity using the DPPH assay. A 20.0 µL sample was added with 80.0 µL of 0.4 mM DPPH 0.4 mM in a well plate. The controls used were 80.0 µL DPPH and 20.0 µL methanol. The solution was incubated for 30 minutes, and then the absorbance was read at the maximum DPPH wavelength (517 nm). The two components of the highest solubility were selected and plotted to the factorial design model based on the categorical factor to assess the miscibility and emulsification process. The self-emulsifying capability comprising time and clarity of the nanodroplet dispersion was evaluated to determine the type of oil, surfactant, and co-surfactant used for further development.
Experimental design for the optimization process
Selected types and concentrations of oil, surfactant, and co-surfactant in the screening process were applied to optimize the nanoemulsion formulation using a D-optimal design. Based on the D-optimal mixture design model, a 16-design point was constructed using StatEase 360 Software (StatEase; Minneapolis, MN). They comprised six runs as model points, five to estimate lack of fit, and five for replicates. Optimized design space was determined by particle size, drug loading, polydispersity index, zeta potential, transmittance, and emulsification time.
Characterization of SNEDDS formulation
Self-emulsification process
The self-emulsification process was assessed based on the emulsification time and dispersion transparency. Emulsification time was measured by diluting the preconcentrate 100 times. An mL nanoemulsion was dropped into 100 mL of distilled water at 37 ± 2°C under a stirring speed of 100 rpm. The time required to form a homogeneous emulsion was noted as emulsification time. The clarity of the nanoemulsion was evaluated using a UV-Vis spectrophotometer (Thermo GenesysTM 10S; Waltham, MA) at 650 nm.
Droplet size, polydispersity index, and zeta potential
Droplet size was measured using a Malvern SZ-100 particle size analyzer (Malvern, UK). The measurement used dynamic light scattering techniques at a wavelength, angle, and refractive index of 632.8 nm, 173°, and 1.333, respectively. The sample absorbance was adjusted to the sample absorbance. Gate time is adjusted in the range of 2.56–10.28 ms. On the other hand, the zeta potential was measured using a carbon cuvette at a temperature of 25°C with a similar device based on the principle of electrophoretic mobility.
Drug Loading
The drug load was assessed based on an antioxidant activity assay, and it was carried out using a UV-Vis spectrophotometer (Thermo Genesys-10; Waltham, MA) at the maximum DPPH wavelength (517 nm) according to the previous method mentioned in the screening section. The antioxidant activity (mM TE/g) was used to calculate the drug loading of the polyherbal combination nanoemulsion based on the percentage of antioxidant activity.
Optimization of SNEDDS formulation and characterization
The data obtained were analyzed using the D-optimal mixture design using StatEase 360 software (StatEase; Minneapolis, MN). Model selection and analysis were performed using a multiple linear regression analysis based on analysis of variance, along with a confidence level of 95%. The optimized nanoemulsion formulation was determined using the software. All parameters determining the critical characteristics of nanoemulsion preparations were transformed into contour plots from the mathematical model. The contour plots were combined into a superimposed contour plot depending on the predetermined quality target product profile.
The optimized formulation was characterized by previous critical quality attributes for verification: droplet size, polydispersity index, drug loading, emulsification time, transmittance, and zeta potential. In addition, the nanoemulsion formation was characterized by transmission electron microscopy. The optimized nanoemulsion sample was dropped on carbon-coated copper grids and stained with 2% uranyl acetate. The grid was then air-dried at room temperature before being placed into the microscope. TEM photographs were read at a magnification of up to 80,000 times to observe the morphology of the nanoemulsion droplets with an electron beam voltage of 100 kV.
Pharmacokinetic study
Pharmacokinetics study was carried out using male Wistar rats (200–250 g). The animals were fasted for 12 hours and had free access to water throughout the experimental period [30]. Animal research was approved by the Health Research Ethics Committee of the Regional General Hospital (RSUD) dr. Moewardi, Surakarta (Reg. No. 1.207/IX/HREC/2022). Two formulations, polyherbal extract and polyherbal nanoemulsion formulation, were administered to male Wister rats (n = 6) orally at 30 mg/kg body weight. Blood samples (0.25 mL) were collected from the orbital sinus at predetermined time points (0.25, 0.5, 0.75, 1, 3, 4, 8, 12, and 24 hours) into microcentrifuge tubes containing EDTA. Plasma was collected by centrifuging the blood at 6000 rpm for 10 minutes, then taking the supernatant (blood plasma). Plasma was precipitated with acetonitrile at a ratio of 2:1, then centrifuged again, and the supernatant was taken. Plasma samples were obtained and stored in a freezer at − 40° C until analytical testing.
The HPLC method was developed to determine the concentration of curcumin, phyllanthin, and asiaticoside using an HPLC system (Waters, Milford, USA) consisting of consisting of a UV/Visible detector (Waters 2489), a pump (Waters 515) along with an automatic injector. The UV detector wavelength was set at 208 nm, and the column (Phenomenex Luna C18 5 µm 460 x 4.6 mm, Milford, MA), isocratic elution pattern with the mobile phase acetonitrile: methanol: 0.1% formic acid (40:30:30) at a flow rate of 1.0 ml/min with an injection volume of 20 µL. This method was found to be linear in the concentration range between 0.5–15 µg/mL in curcumin (R2 0.9992; [peak areacurcumin] = 75.363*[concentration] + 7.1407) and phyllanthin (R20.999; [peak areaphyllanthin] = 90.883*[concentration] + 33.59). This method was validated with plasma and addition methods.
The curcumin and phyllanthin plasma concentrations were plotted in a graph, and the pharmacokinetics parameters were calculated using PK solver v2.0, along with a non-compartmental model. The pharmacokinetic parameters determined include the maximum concentration of the drug in the body (Cmax), the time when the drug reaches the maximum concentration (Tmax), and the area under the curve. (AUC0-t). The parameters obtained in the two groups were compared with the Student t-test, along with a confidence level of 90%.
Screening process
Different types of oils and surfactants, for example, chain length and triglyceride fatty acid substitution, had unique patterns of miscibility. In addition, the lipophilicity of active pharmaceutical ingredients has a more significant impact on the changes in the characteristics of isotropic mixtures and the induced phase separation of isotropic mixtures of oil, surfactant, and co-surfactant [31]. Screening of nanoemulsion components was carried out to obtain the most appropriate oil, surfactant, and co-surfactant phase components. The solubility of active moiety in the carrier is a fundamental factor in selecting the most appropriate component [32]. The antioxidant activity measured the solubility of active moieties in a polyherbal extract combination, presented in Fig. 1. Many components were excluded due to low antioxidant activity (low solubility power).
According to the solubility, two components with the highest solubility were selected to be candidates for forming the isotropic mixture and emulsification process. The emulsification time and transmittance were the parameters for selecting oil, surfactant, and co-surfactant. It is presented in Table 1. There was immiscibility between components due to the presence of Capmul GMO; however, the miscibility between components was achieved when propylene glycol mono esters modification was applied (Capmul PG-8). The more hydrophilic structure altered the interaction between components. The miscibility of preconcentrated nanoemulsion formulation is crucial due to isotropic behaviour. Thereafter, the energy of surfactant diffusion is used to form nanodroplets.
Moreover, the surfactant played a fundamental role in the spontaneous emulsification [27]. The data indicated that all the isotropic mixtures produced spontaneous emulsification (< 10 sec). However, the presence of Transcutol P increased the clarity. The bluish colour indicated the formation of nanodroplets; the more transparent the appearance, the smaller the droplet size. Co-surfactants interact with surfactants to stabilize the system; hence, they are critical components and increase the solubility of active compounds. According to the data, Capmul PG-8, Kolliphor RH40, and Transcutol were selected as oil, surfactant, and co-surfactant, respectively.

Characterization of SNEDDS formulation
Nanoemulsion characterization was carried out to obtain the model for predicting the effect of the main component and interaction and the optimized formulation. Emulsification time, transmittance, droplet size, polydispersity index, zeta potential, antioxidant activity, and drug loading were applied as responses. The results of nanoemulsion characterization are presented in Table 2. The data were statistically analyzed using a multiple linear regression analysis with the D-optimal design model, and the results are presented in Table 3. The selection of the regression model based on several goodness of fit parameters, namely, significant model (p < 0.05), R2 more than 0.7, the difference between adjusted R2 dan predicted R2 less than 0.2, insignificant lack of fit (p > 0.05), and the linear mixture was significant (p < 0.05) are an ideal model fitting parameter.
Effect on self-emulsification process
The emulsification time shows the spontaneous emulsification process to form a nano-sized dispersion when the nanoemulsion preconcentrate is introduced into the medium [33]. All formulations showed spontaneous emulsification without precipitation (confirmed by observation after centrifugation). This data proved that the SNEDDS-based nanoemulsion formulation increased the solubility of the combination of polyherbal extracts in nanodroplet dispersions. The resulting emulsification time in all experimental designs was less than 30 seconds (Table 2). Emulsification time parameters were analyzed using multiple linear regression. The quadratic model produced in the emulsification time analysis was insignificant (p > 0.05), and the lack of fit was significant (p < 0.05) (Table 3). It indicated that the emulsification time did not differ significantly because it was a narrow range (4–8 sec). Therefore, the oil phase, surfactant, and co-surfactant variations did not affect the emulsification time. Therefore, the emulsification time would not be applied to determine the optimized nanoemulsion formulation.
The transmittance showed the visual appearance of the nanoemulsion as indicated by the clarity of the preconcentrated nanoemulsion when emulsified spontaneously [25]. The transmittance values produced in all formulations varied from 60 to 70% (Table 2). The transmittance parameter was analyzed using multiple linear regression. The cubic model produced in the transmittance analysis was significant (p < 0.05), and the lack of fit was insignificant (p > 0.05) (Table 3). However, there was a tendency to misguide the model due to the negative value of Pred. R2 [34].
The regression model (Table 3) showed that Kolliphor RH40, a surfactant, was dominant in increasing the transmittance. Kolliphor RH40 is a nonionic surfactant with a branched alkyl structure capable of spontaneously forming emulsions, reducing the droplet size, and stabilizing it [35]. Nazlı et al. (2021) reported that Kolliphor RH40 as a surfactant increased the transmittance value with a transparent appearance. Transcutol P was two times greater than Capmul PG8 in increasing the transmittance value. The interaction coefficient showed an antagonistic interaction between Capmul PG8 and Kolliphor RH40 (regression coefficient − 49.71) and Kolliphor RH40 and Transcutol P (regression coefficient − 134.10), thereby causing a decrease in transmittance (p < 0.05). The contour plot (Fig. 2a) provided information on the influence of Capmul PG8, Kolliphor RH40, and Transcutol P on the transmittance. The results showed that the increase in transmittance was affected by a high proportion of Kolliphor RH40. On the other hand, the contour plot showed an interaction between Kolliphor RH40, Capmul PG8, and Transcutol P in certain proportions which caused an increase in the transmittance.
Effect on droplet size, polydispersity index, and zeta potential
Droplet size is critical to the performance of nanoemulsions because droplet size can help the absorption of drugs delivered through M-cells—the smaller the droplet size, the greater the surface area, thereby speeding up the absorption process. Generally, nanoemulsion droplet sizes range from 20–500 nm [35, 37]. The droplet size of all formulations ranged from 192.13 to 616.13 nm. A quadratic model was implemented, and it produced a significant model (p < 0.05) with an insignificant lack of fit (p > 0.05) (Table 3).
Based on the regression coefficient (Table 3), Capmul PG8 greatly influenced the reducing droplet size. The effect of Capmul PG8 was two times greater than Transcutol P and four times greater than Kolliphor RH 40. Generally, the oil phase increases the droplet size of the nanoemulsion [38]. This phenomenon was affected by the alteration of oil characteristics through the modification of the lipophilicity. Capmul PG8 (propylene glycol monocaprylate) is conjugated with propylene glycol, enhancing its hydrophilicity. Mountain et al. (2014) reported that Capmul PG8 significantly reduced the size of nanoemulsion droplets. The interaction coefficient showed that the interaction between Kolliphor RH40 and Transcutol P had the most dominant effect on reducing droplet size with a regression coefficient of -1.56 compared to the influence of each component. Combining surfactant and co-surfactant can reduce droplet size and increase nanoemulsion stability. Md et al. (2021) reported that the droplet size decreased with increasing combination of surfactant and co-surfactant. The higher drug loading contributed to this phenomenon. The solubility of active moieties increased when there was a higher proportion of surfactant and co-surfactant.
Meanwhile, the amount of drug loading reduced the droplet size [31]. The contour plot (Fig. 2b) showed that the smallest droplet size was achieved when the concentration of Capmul PG 8 was at the highest proportion. Meanwhile, the larger droplet size was obtained at a high proportion of Kolliphor RH 40, along with the low level of Transcutol P. Therefore, the nanoemulsion formed was less stable due to the lack of a co-surfactant to help increase the stability of the nanoemulsion. The bulk structure of Kolliphor RH40 and the branched alkyl structure requires more stabilization; hence, the co-surfactant was the critical part of the droplet stabilization [35].
| Run | Proportion (%) | Critical Quality Attributes | |||||||||
|---|---|---|---|---|---|---|---|---|---|---|---|
| O | S | CS | ET (s) | T (%) | DS (nm) | PDI | ZP (mV) | AA (mM TE/g) | DL (%w/v) | ||
| 1 | 40.00 | 31.74 | 28.26 | 6.84 ± 0.12 | 61.27 ± 1.21 | 192.13 ± 60.4 | 0.302 ± 0.04 | -21.55 ± 5.75 | 0.110 ± 0.00 | 11.61 ± 0.49 | |
| 2 | 23.82 | 44.60 | 31.58 | 6.26 ± 1.63 | 64.72 ± 0.16 | 254.67 ± 71.3 | 0.465 ± 0.04 | -26.40 ± 2.45 | 0.305 ± 0.01 | 32.06 ± 0.10 | |
| 3 | 11.00 | 45.61 | 43.38 | 6.42 ± 0.47 | 60.88 ± 0.49 | 473.80 ± 16.9 | 0.516 ± 0.02 | -28.40 ± 1.87 | 0.317 ± 0.02 | 33.32 ± 2.51 | |
| 4 | 40.00 | 40.00 | 20.00 | 5.36 ± 0.41 | 62.22 ± 1.12 | 301.30 ± 89.8 | 0.401 ± 0.04 | -22.52 ± 1.52 | 0.106 ± 0.01 | 11.14 ± 0.81 | |
| 5 | 10.00 | 54.80 | 35.20 | 6.58 ± 0.15 | 65.23 ± 1.12 | 479.57 ± 118.4 | 0.538 ± 0.05 | -18.30 ± 2.40 | 0.313 ± 0.04 | 32.85 ± 4.19 | |
| 6 | 14.12 | 35.88 | 50.00 | 5.03 ± 1.44 | 67.42 ± 1.37 | 451.50 ± 28.1 | 0.456 ± 0.28 | -23.67 ± 0.90 | 0.274 ± 0.02 | 28.75 ± 2.00 | |
| 7 | 20.55 | 59.45 | 20.00 | 8.30 ± 0.79 | 63.18 ± 2.39 | 616.13 ± 29.1 | 0.528 ± 0.03 | -11.83 ± 1.25 | 0.243 ± 0.02 | 25.59 ± 2.11 | |
| 8 | 18.39 | 53.21 | 28.41 | 5.92 ± 0.34 | 63.03 ± 1.70 | 596.90 ± 20.6 | 0.431 ± 0.06 | -15.82 ± 1.94 | 0.320 ± 0.03 | 33.68 ± 2.78 | |
| 9 | 10.00 | 54.80 | 35.20 | 6.99 ± 0.93 | 65.63 ± 1.02 | 604.77 ± 115.3 | 0.611 ± 0.09 | -26.38 ± 3.18 | 0.367 ± 0.01 | 38.53 ± 1.09 | |
| 10 | 33.00 | 30.00 | 37.00 | 6.38 ± 0.43 | 61.45 ± 1.13 | 319.35 ± 21.1 | 0.388 ± 0.06 | -27.00 ± 1.50 | 0.296 ± 0.01 | 31.08 ± 0.86 | |
| 11 | 23.82 | 44.60 | 31.58 | 5.78 ± 0.86 | 63.93 ± 1.02 | 249.00 ± 72.3 | 0.381 ± 0.04 | -25.07 ± 0.71 | 0.317 ± 0.02 | 33.32 ± 2.11 | |
| 12 | 23.82 | 44.60 | 31.58 | 5.83 ± 1.25 | 64.14 ± 1.15 | 255.70 ± 45.8 | 0.400 ± 0.04 | -26.00 ± 1.93 | 0.298 ± 0.03 | 31.33 ± 3.08 | |
| 13 | 23.82 | 44.60 | 31.58 | 6.38 ± 2.09 | 63.48 ± 2.34 | 243.77 ± 25.8 | 0.384 ± 0.02 | -26.87 ± 1.80 | 0.307 ± 0.10 | 32.25 ± 10.02 | |
| 14 | 24.22 | 30.01 | 45.76 | 4.12 ± 0.41 | 63.95 ± 0.48 | 241.25 ± 32.2 | 0.377 ± 0.07 | -27.53 ± 0.85 | 0.292 ± 0.02 | 30.68 ± 1.90 | |
| 15 | 30.41 | 49.59 | 20.00 | 4.73 ± 0.10 | 60.22 ± 1.42 | 434.40 ± 47.4 | 0.392 ± 0.08 | -27.83 ± 0.45 | 0.219 ± 0.08 | 22.98 ± 8.06 | |
| 16 | 14.12 | 35.88 | 50.00 | 5.50 ± 1.58 | 66.80 ± 1.44 | 406.67 ± 41.3 | 0.465 ± 0.03 | -25.10 ± 1.53 | 0.348 ± 0.01 | 36.54 ± 0.90 | |
| Para- meters | ET (s) | T (%) | DS (nm) | PDI | 1/ZP (mV) | AA (mM TE/g) | DL (%w/v) | |||||||
|---|---|---|---|---|---|---|---|---|---|---|---|---|---|---|
| Coef | p | Coef | p | Coef | p | Coef | p | Coef | p | Coef | p | Coef | p | |
| A | 6.89 | 43.34 | 359.25 | 0.2587 | -0.0970 | -0.0763 | -8.02 | |||||||
| B | 10.10 | 0.095 | 101.58 | 0.0001 | 1102.24 | 0.0005 | 0.5837 | 0.0002 | -0.1800 | 0.0034 | 0.2565 | 0.0001 | 26.95 | 0.0001 |
| C | 4.08 | 88.36 | 661.71 | 0.4613 | -0.0842 | 0.2225 | 23.38 | |||||||
| AB | -10.84 | 0.071 | -49.71 | 0.0012 | -1284.64 | 0.0213 | - | - | 0.3955 | 0.0010 | 0.4634 | 0.0380 | 48.71 | 0.0380 |
| AC | 1.50 | 0.767 | -15.14 | 0.1088 | -1095.89 | 0.0290 | - | - | 0.2268 | 0.0471 | 0.8275 | 0.0009 | 86.96 | 0.0009 |
| BC | -2.31 | 0.669 | -134.10 | 0.0001 | -1555.22 | 0.0070 | - | - | 0.4044 | 0.0018 | 0.3687 | 0.0806 | 38.74 | 0.0806 |
| ABC | - | - | 226.05 | 0.0001 | - | - | - | - | - | - | - | - | - | - |
| Goodness of fit | ||||||||||||||
| Model | - | 0.118 | - | 0.0001 | - | 0.0012 | - | 0.0002 | - | 0.0036 | - | 0.0001 | - | 0.0001 |
| LoF | - | 0.006 | - | 0.7768 | - | 0.0549 | - | 0.3450 | - | 0.3937 | - | 0.4986 | - | 0.4986 |
| R2 | 0.5394 | 0.9832 | 0.8337 | 0.7335 | 0.9169 | 0.8947 | 0.8947 | |||||||
| Adj R2 | 0.3091 | 0.9579 | 0.7505 | 0.6924 | 0.8219 | 0.8420 | 0.8420 | |||||||
| Pred R2 | -1.3792 | -0.9820 | 0.5539 | 0.6014 | -0.0758 | 0.6421 | 0.6421 | |||||||
A = Capmul PG 8 NF; B = Kolliphor RH 40; C = Transcutol P; ET = Emulsification time (second); T = Transmittance (%); DS = Droplet size (nm); PDI = polydispersity index; ZP = Zeta potential (mV); AA = Antioxidant activity (mM TE/g); DL = Drug loading (%w/v). Coef = Regression coefficient; LoF = Lack of fit; R2 = Determination coefficient; Adj R2 = Adjusted R2; Pred R2 = Predicted R2; p = p-value.
The polydispersity index (PDI) contributed to the variation of nanoemulsion droplet size. Generally, a good droplet size distribution has a monodispersed system and a low PDI value (less than 0.5). The smaller the polydispersion index value, the more homogeneous the droplet size distribution (Das & Chaudhury, 2011). The PDI values for all formulations varied between 0.2 to 0.6. The linear regression model showed that the model was significant (p < 0.05), and lack of fit was not significant (p > 0.05) (Table 3). According to the regression coefficient, Capmul PG8 as the oil phase significantly reduced the droplet size variation (regression coefficient 0.26). The data revealed the non-native effect of the oil phase; generally, it broadens the size distribution of nanoemulsion. This work proved that modified oil lipophilicity altered the oil's effect in increasing the droplet size variation. The linear model for this parameter proved no interaction between Kolliphor RH40, Capmul PG 8, and Transcutol P on the polydispersity index. The contour plot (Fig. 2c) showed that the lowest PDI value was at the highest concentration of Capmul PG8. The shifting of Kolliphor RH40 concentration had a linear effect on increasing the droplet size distribution. In addition, the co-surfactant in this system had a negligible effect on the droplet size distribution.
Zeta potential describes the long-term stability of emulsion droplets by identifying the charge of oil droplets in nanoemulsions [41]. The attraction between particles increases and causes the dispersion system to experience flocculation [38]. Zeta potential of all formulas ranged from − 30 to -10 mV (Table 2). The zeta potential parameter was analyzed using multiple linear regression and inverse transformation. The transformation process was applied to improve the model's goodness of fit [28]. The quadratic model produced in the zeta potential analysis was significant (p < 0.05), the lack of fit was not significant (p > 0.05), and the linear mixture was significant (p < 0,05) (Table 3).
Based on the regression coefficient, Transcutol P as a co-surfactant contributed to reducing zeta potential (regression coefficient − 0.084). The interaction between the two components had a more significant effect on the alteration of zeta potential than the main effect. The most dominant synergistic interaction in reducing zeta potential was the interaction between Kolliphor RH40 and Transcutol P (regression coefficient 0.404). This interaction could work synergistically to increase the dispersibility of the surfactant in the oil phase and produce a smaller droplet size, thereby increasing the stability and homogeneity of the nanoemulsion. [17–19, 21]. The contour plot (Fig. 2d) showed that the zeta potential was the smallest at the high proportion of Transcutol P and Kolliphor RH40 and a low fraction of Capmul PG8. The negative charge on the droplets is due to anionic groups in the oil phase and glycol in the co-surfactant [42].
Effect on Antioxidant activity and Drug loading
An antioxidant assay is intended to determine the presence of antioxidant activity in the formulation. The compounds were crucial in providing antioxidant effects [43]. The antioxidant data was also implemented to calculate the drug loading. The antioxidant activity varied from 0.106 to 0.367 mM Trolox equivalent/g; this data was affected by the system's ability to incorporate the bioactive compound in the nanoemulsion. Drug loading measures the ability of the system to incorporate a predetermined number of active moieties. Higher drug loading promotes greater efficiency and increases flexibility to regulate dosage form amounts during administration. However, increasing drug loading also increased the nanoemulsion droplet size [44, 45]. Moreover, the drug loading ranged from 10 to 35.86 mg/g. Those parameters were analyzed using multiple linear regression. Those models met the adequacy of data prediction (significant model (p < 0.05) and insignificant lack of fit (p > 0.05) (Table 3). Kolliphor RH 40 and Transcutol P played a dominant role in increasing antioxidant activity and drug loading; wh]ereas, the effect of Capmul PG8 was inversely proportional to antioxidant activity and drug loading. The amphiphilic nature of surfactant and co-surfactant helps the solubility of active compounds in the nanoemulsion system. Compared to the oil phase, both components had a higher effect on antioxidant activity due to solubility power [46]. However, co-surfactant as a co-solvent in Capmul PG8 increased the antioxidant activity synergistically. Čerpnjak et al. (2013) reported that surfactants could increase drug solubility in the system. This ability can cause an increase in antioxidant activity in nanoemulsion.
The contour plots of antioxidant activity and drug loading are presented in Figs. 2e and 2f, respectively. Both data had similar patterns. The contour plot revealed that the greatest antioxidant activity and drug loading were influenced by the highest concentration of Kolliphor RH40 and the lowest concentration of Capmul PG8. The lowest antioxidant activity and drug loading were observed at the highest concentration of Capmul PG 8. Surfactants and co-surfactants not only play a role in the formation of spontaneous emulsification to form nano-dispersions but are also able to increase drug loading by increasing the solubility of drugs in the oil phase and trapping lipophilic drugs in the oil phase so that drug loading into the dosage will be more effective and optimal [47, 48]. The interaction coefficient proved that the most dominant synergistic interaction in increasing drug loading occurs between Capmul PG8 and Transcutol P.
Determination of optimized formulation
The superimposed contour plot was constructed to determine the optimized region depending on the quality of the product profile, which is presented in Table 4. The optimized region was achieved and limited by droplet size (nm), polydispersity index, antioxidant activity (mM TE/g), and drug loading (%w/v). Thus, the optimized formulation was obtained at 29.08% Capmul PG8, 35.52% Kolliphor RH40, and 35.41% Transcutol P. The optimized formulation was verified (Table 5), and all parameters were verified except for zeta potential, antioxidant activity, and drug loading. Zeta potential had an impossible prediction point (-39.50 mV) due to a misleading model prediction; therefore, it had an unverified model. In addition, the residual value of antioxidant activity and drug loading were less than 10%. Although, they were unverified due to significant differences between prediction and observed data.
| Parameter | Goal | Lower limit | Upper limit |
|---|---|---|---|
| Droplet size (nm) | Minimum | 192,133 | 300 |
| Polydispersity index | Minimum | 0,302 | 0,611 |
| Antioxidant activity (mM TE/g) | Maximum | 0,106 | 0,367 |
| Drug load (%w/v) | Maximum | 10,373 | 35,861 |
| Parameter | Predicted data | Obtained data | Residual (%) |
|---|---|---|---|
| Emulsification time (s) | 5,69 | 5,68 ± 0,48 | -0,18 |
| Transmittance (%) | 65,68 | 65,50 ± 2,27 | -0,27 |
| Droplet size (nm) | 209,80 | 201,6 ± 10,09 | -3,91 |
| Polydispersity index | 0,38 | 0,40 ± 0,06 | 3,62 |
| Zeta potential (mV) | -39,50 | -29,84 ± 1,60 | -24,46* |
| Antioxidant activity (mM TE/g) | 0,29 | 0,26 ± 0,01 | -9,81* |
| Drug load (%w/v) | 30,14 | 27,20 ± 0,89 | -9,75* |
| * p-value < 0,05 | |||
The droplet size distribution (Fig. 3a) showed the bi-disperse system. The first peak indicated the presence of micellar aggregates, and the greater peak indicated the nanoemulsion. However, the TEM visualization (Fig. 3b) showed that the particle size distribution ranged around 50–200 nm. The different visualization due to the DLS measures the hydrodynamic diameter when the presence of bulk structure and branch chain of surfactant modified on the surface of the nanoemulsion system.
Pharmacokinetics study
The application of nanoemulsion is intended to enhance the bioavailability of bioactive compounds in the polyherbal. There were three targets of bioactive compounds, e.i., curcumin, phyllanthin, and asiaticoside, that corresponded to bioactive compounds of Curcuma xanthoriza and Curcuma domestica, Phyllanthus niruri, and Centella asiatica, respectively. However, only two compounds were detected in plasma: curcumin and phyllanthin. The pharmacokinetics profiles of curcumin and phyllanthin are presented in Fig. 4. The pattern of both pharmacokinetics profiles was similar. The nanoemulsion enhanced both bioactive compounds in plasma concentration. In order to quantify the pharmacokinetics profiles, several parameters were applied: the maximum concentration and time (Cmax and Tmax), half-time (t1/2), and the area under the curve (AUC) are shown in Table 6. The Cmax of curcumin and phyllanthin in nanoemulsion formulation was higher than that of the extract suspension by 1.35 and 1.42 times, respectively. However, there was an extent of absorption due to the increase in the Tmax of curcumin; meanwhile, the phyllanthin did not. T1/2 of curcumin and phylantin nanoemulsion was longer (nearly 1.5 times) than that of extract preparations, indicating that curcumin and phylantin remained in plasma longer.
| Parameter | Curcumin | Phyllanthin | ||
|---|---|---|---|---|
| Extract | Nanoemulsion | Extract | Nanoemulsion | |
| AUC0 − t (µg×h/mL) | 56.93 ± 23.20 | 135.71 ± 65.32 | 88.55 ± 37.50 | 140.68 ± 28.04 |
| Cmax (µg/mL) | 6.68 ± 0.53 | 9.03 ± 0.06 | 7.41 ± 1.81 | 10.56 ± 0.43 |
| Tmax (h) | 0.83 ± 0.08 | 1.75 ± 1.13 | 1.33 ± 0.33 | 1.33 ± 0.33 |
| Ke (h− 1) | 0.08 ± 0.01 | 0.04 ± 0.00 | 0.03 ± 0.01 | 0.03 ± 0.01 |
| T1/2 (h) | 8.58 ± 1.22 | 13.06 ± 5.78 | 13.65 ± 2.62 | 21.51 ± 3.50 |
AUC0 − t = area under curve time 0 to 24 hours (µg hour/mL); Cmax = peak concentration (µg/mL); Tmax = time required for the analyte to reach peak levels (hour); Ke = Elimination rate (hour− 1); T1/2 = half-life (hour).
The AUC0 − 24 of curcumin and phyllanthin in the nanoemulsion formulation increased 2.38-fold and 1.59-fold compared with the extract suspension. These results correlated to the Tmax and Cmax data. This data showed that the oral bioavailability of curcumin and phyllanthin was increased via the SNEDDS-based nanoemulsion system. This increase in oral bioavailability via SNEDDS can be explained by the increased fraction of drugs transported via the intestinal lymphatic system [49]. Besides that, the drug can be dissolved into the interface film formed by surfactants; therefore, the drug in the gastrointestinal tract can enter in soluble form; the sustained release effect of nanoemulsions can increase the residence time of drugs in the systemic circulation [50]. Nanoemulsions can increase drug bioavailability by increasing the intestinal permeability of drugs and the transport ratio of drug compounds through the lymphatic pathway. Based on the research results, it can be concluded that SNEDDS-based nanoemulsion is an effective method for increasing the oral bioavailability of curcumin and phyllanthin compounds.
An integrated statistical model has successfully developed a nanoemulsion containing polyherbal complexes. Miscibility between components in forming an isotropic mixture is an individual response according to the mixture, and it was a critical contribution to spontaneous emulsification. The more hydrophilic/modified oil could alter the native effect of oil in increasing the droplet size. The synergistic interaction was also observed when surfactant and co-surfactant were in dominant proportion. The optimized formulation was obtained at 29.08% Capmul PG8, 35.52% Kolliphor RH40, and 35.41% Transcutol P, which contributed the particle size of less than 200 nm and high drug loading (27% w/v). The optimized formulation complied with the requirement of zeta potential for stability. Finally, the nanoemulsion containing polyherbals proved the enhancement of curcumin and phyllanthin bioavailability around two times when compared with conventional extracts.
Declaration of interest
All authors declare there was no conflict of interest.
Funding
This research was funded by "Penelitian Unggulan Terapan" (PUT-UNS), Universitas Sebelas Maret, along with contract number 194.2/UNS27.22/PT.01.03/2024.
Author Contribution
Conceptualization, S. Choiri; Data curation, N Wiyono; Formal analysis, N Wiyono; Funding aquisiton, A. Ainurofiq; Investigation, A. Ainurofiq; Methodology, S. Choiri; Project administration, MQ Alkatiri; Resources, S. Choiri; Software, MQ Alkatiri; Supervision, S. Choiri; Validation, A. Ainurofiq; Visualization, APF Sari; Writing-original draft, APF Sari; Writing review & editing, S.Choiri.
Acknowledgement
The authors would like to thank Abitec (Columbus, Ohio), Gattefose (Saint-Priest, France), and BASF (Ludwigshafen, Germany) for providing the excipient.
- Ainurofiq, A., Wiyono, N., Warni, R., & Choiri, S. (2023). Assessment of the synergistic effect of a poly-herbals combination on the antioxidant activity through a statistical approach. F1000Research, 11, 1327.
- Colombo, R., de L. Batista, A. N., Teles, H. L., Silva, G. H., Bomfim, G. C. C.,Burgos, R. C. R., … Heimberg, M. C. H. (2009). Validated HPLC method for the standardization of Phyllanthus niruri (herb and commercial extracts) using corilagin as a phytochemical marker. Biomedical Chromatography, 23(6), 573–580. https://doi.org/10.1002/bmc.1155.
- Li, L., Zhang, X., Pi, C., Yang, H., Zheng, X., Zhao, L., & Wei, Y. (2020). Review of curcumin physicochemical targeting delivery system. International Journal of Nanomedicine, 15, 9799–9821. https://doi.org/10.2147/IJN.S276201
- Gong, C., Wu, Q., Wang, Y., Zhang, D., Luo, F., Zhao, X., … Qian, Z. (2013). A biodegradable hydrogel system containing curcumin encapsulated in micelles for cutaneous wound healing.Biomaterials, 34(27), 6377–6387. https://doi.org/10.1016/j.biomaterials.2013.05.005.
- Hanh, N. D., Sinchaipanid, N., & Mitrevej, A. (2014). Physicochemical characterization of phyllanthin from Phyllanthus amarus Schum. et Thonn. Drug Development and Industrial Pharmacy, 40(6), 793–802. https://doi.org/10.3109/03639045.2013.788010
- Zhang, C.-Z., Niu, J., Chong, Y.-S., Huang, Y.-F., Chu, Y., Xie, S.-Y., … Peng, L.-H.(2016). Porous microspheres as promising vehicles for the topical delivery of poorly soluble asiaticoside accelerate wound healing and inhibit scar formation in vitro& in vivo. European Journal of Pharmaceutics and Biopharmaceutics, 109, 1–13. https://doi.org/10.1016/j.ejpb.2016.09.005.
- Lala, R. R., & Patel, P. H. (2019). Nanoemulsion for improved permeability of Centella asiatica extract: formulation, ex-vivo and in-vivo evaluation. International Journal of Pharmaceutical Sciences and Research, 10(4), 1711–1718.
- Eid, S. Y., El-Readi, M. Z., Eldin, E. E. M. N., Fatani, S. H., & Wink, M. (2013). Influence of combinations of digitonin with selected phenolics, terpenoids, and alkaloids on the expression and activity of P-glycoprotein in leukaemia and colon cancer cells. Phytomedicine, 21(1), 47–61. https://doi.org/10.1016/j.phymed.2013.07.019
- Bonifácio, B., Silva, P., Ramos, M., Negri, K., Bauab, M., T., & Chorilli, M. (2013). Nanotechnology-based drug delivery systems and herbal medicines: a review. International Journal of Nanomedicine, 1. https://doi.org/10.2147/IJN.S52634
- Kassem, A. A., Mohsen, A. M., Ahmed, R. S., & Essam, T. M. (2016). Self-nanoemulsifying drug delivery system (SNEDDS) with enhanced solubilization of nystatin for treatment of oral candidiasis: Design, optimization, in vitro and in vivo evaluation. Journal of Molecular Liquids, 218, 219–232. https://doi.org/10.1016/j.molliq.2016.02.081
- Balakumar, K., Raghavan, C. V., selvan, N. T., prasad, R. H., & Abdu, S. (2013). Self nanoemulsifying drug delivery system (SNEDDS) of Rosuvastatin calcium: Design, formulation, bioavailability and pharmacokinetic evaluation. Colloids and Surfaces B: Biointerfaces, 112, 337–343. https://doi.org/10.1016/j.colsurfb.2013.08.025
- Yao, M., Li, Z., Julian McClements, D., Tang, Z., & Xiao, H. (2020). Design of nanoemulsion-based delivery systems to enhance intestinal lymphatic transport of lipophilic food bioactives: Influence of oil type. Food Chemistry, 317, 126229. https://doi.org/10.1016/j.foodchem.2020.126229
- Heshmati, N., Cheng, X., Eisenbrand, G., & Fricker, G. (2013). Enhancement of Oral Bioavailability of E804 by Self-Nanoemulsifying Drug Delivery System (SNEDDS) in Rats. Journal of Pharmaceutical Sciences, 102(10), 3792–3799. https://doi.org/10.1002/jps.23696
- Xi, J., Chang, Q., Chan, C. K., Meng, Z. Y., Wang, G. N., Sun, J. B., … Zheng, Y.(2009). Formulation development and bioavailability evaluation of a self-nanoemulsified drug delivery system of oleanolic acid. American Association of Pharmaceutical Scientists PharmSciTech, 10(1), 172–182. https://doi.org/10.1208/s12249-009-9190-9.
- Morakul, B. (2020). Self-nanoemulsifying drug delivery systems (SNEDDS): an advancement technology for oral drug delivery. Pharmaceutical Sciences Asia, 47(3), 205–220. https://doi.org/10.29090/psa.2020.03.019.0121
- Cherniakov, I., Domb, A. J., & Hoffman, A. (2015). Self-nano-emulsifying drug delivery systems: an update of the biopharmaceutical aspects. Expert Opinion on Drug Delivery, 12(7), 1121–1133. https://doi.org/10.1517/17425247.2015.999038
- Cho, Y. H., Kim, S., Bae, E. K., Mok, C. K., & Park, J. (2008). Formulation of a Cosurfactant-Free O/W Microemulsion Using Nonionic Surfactant Mixtures. Journal of Food Science, 73(3), E115–E121. https://doi.org/10.1111/j.1750-3841.2008.00688.x
- Čerpnjak, K., Zvonar, A., Gašperlin, M., & Vrečer, F. (2013). Lipid-based systems as a promising approach for enhancing the bioavailability of poorly water-soluble drugs. Acta Pharmaceutica, 63(4), 427–445. https://doi.org/10.2478/acph-2013-0040
- Kazi, M., Shahba, A. A., Alrashoud, S., Alwadei, M., Sherif, A. Y., & Alanazi, F. K. (2020). Bioactive self-nanoemulsifying drug delivery systems (Bio-SNEDDS) for combined oral delivery of curcumin and piperine. Molecules, 25(7), 1703. https://doi.org/10.3390/molecules25071703
- Kuncahyo, I., Choiri, S., Fudholi, A., Martien, R., & Rohman, A. (2023). Development of pitavastatin-loaded super-saturable self-nano emulsion: a continues screening and optimization approach using statistical technique. Journal of Dispersion Science and Technology, 44(4), 608–617. https://doi.org/10.1080/01932691.2021.1957922
- Md, S., Alhakamy, N. A., Aldawsari, H. M., Ahmad, J., Alharbi, W. S., & Asfour, H. Z. (2021). Resveratrol loaded self-nanoemulsifying drug delivery system (SNEDDS) for pancreatic cancer: Formulation design, optimization and in vitro evaluation. Journal of Drug Delivery Science and Technology, 64, 102555. https://doi.org/10.1016/j.jddst.2021.102555
- Kuncahyo, I., Choiri, S., & Fudholi, A. (2019). Solidification of meloxicam self-nano emulsifying drug delivery system formulation incorporated into soluble and insoluble carriers using freeze drying method (Vol. 578). Presented at the IOP Conference Series: Materials Science and Engineering. https://doi.org/10.1088/1757-899X/578/1/012051
- Venkatesh, M., & Mallesh, K. (2013). Self-Nano Emulsifying Drug Delivery System (SNEDDS) for Oral Delivery of Atorvastatin - Formulation and Bioavailability Studies. Journal of Drug Delivery and Therapeutics, 3(3), 131–140. https://doi.org/10.22270/jddt.v3i3.517
- Jakab, G., Fülöp, V., Bozó, T., Balogh, E., Kellermayer, M., & Antal, I. (2018). Optimization of Quality Attributes and Atomic Force Microscopy Imaging of Reconstituted Nanodroplets in Baicalin Loaded Self-Nanoemulsifying Formulations. Pharmaceutics, 10(4), 275. https://doi.org/10.3390/pharmaceutics10040275
- Kuncahyo, I., Choiri, S., Fudholi, A., Martien, R., & Rohman, A. (2019). Assessment of fractional factorial design for the selection and screening of appropriate components of a self-nanoemulsifying drug delivery system formulation. Advanced Pharmaceutical Bulletin, 9(4), 609–618. https://doi.org/10.15171/apb.2019.070
- Qian, J., Meng, H., Xin, L., Xia, M., Shen, H., Li, G., & Xie, Y. (2017). Self-nanoemulsifying drug delivery systems of myricetin: Formulation development, characterization, and in vitro and in vivo evaluation. Colloids and Surfaces B: Biointerfaces, 160, 101–109. https://doi.org/10.1016/j.colsurfb.2017.09.020
- Khatri, P., & Shao, J. (2018). Mechanism and structural factors of lipid and surfactant in the formation of self-emulsified nanoemulsion. Journal of Pharmaceutical Sciences, 107(8), 2198–2207. https://doi.org/10.1016/j.xphs.2018.03.024
- Kuncahyo, I., Indrayati, A., & Choiri, S. (2023). Rational Design and Development of a Soluble Mesoporous Carrier for the Solidification of a Preconcentrated Self-Nanoemulsion Formulation. ACS Omega, 8(41), 38676–38689. https://doi.org/10.1021/acsomega.3c05948
- Younes, I., Ghorbel-Bellaaj, O., Chaabouni, M., Rinaudo, M., Souard, F., Vanhaverbeke,C., … Nasri, M. (2014). Use of a fractional factorial design to study the effects of experimental factors on the chitin deacetylation. International Journal of Biological Macromolecules, 70, 385–390. https://doi.org/10.1016/j.ijbiomac.2014.06.051.
- Thomson, M., Al-Qattan, K. K., Js, D., & Ali, M. (2016). Anti-diabetic and anti-oxidant potential of aged garlic extract (AGE) in streptozotocin-induced diabetic rats. Bio Med Central Complementary and Alternative Medicine, 16(1), 17. https://doi.org/10.1186/s12906-016-0992-5
- Lefebvre, G., Riou, J., Bastiat, G., Roger, E., Frombach, K., Gimel, J.-C., … Calvignac,B. (2017). Spontaneous nano-emulsification: Process optimization and modeling for the prediction of the nanoemulsion’s size and polydispersity. International Journal of Pharmaceutics, 534(1–2), 220–228. https://doi.org/10.1016/j.ijpharm.2017.10.017.
- Villar, A. M. S., Naveros, B. C., Campmany, A. C. C., Trenchs, M. A., Rocabert, C. B., & Bellowa, L. H. (2012). Design and optimization of self-nanoemulsifying drug delivery systems (SNEDDS) for enhanced dissolution of gemfibrozil. International Journal of Pharmaceutics, 431(1–2), 161–175. https://doi.org/10.1016/j.ijpharm.2012.04.001
- Parmar, K., Patel, J., & Sheth, N. (2015). Self nano-emulsifying drug delivery system for Embelin: Design, characterization and in-vitro studies. Asian Journal of Pharmaceutical Sciences, 10(5), 396–404. https://doi.org/10.1016/j.ajps.2015.04.006
- Choiri, S., Sulaiman, T. N. S., & Rohman, A. (2020). Assessment of the effect of polymers combination and effervescent component on the drug release of swellable gastro-floating tablet formulation through compartmental modeling-based approach. Drug Development and Industrial Pharmacy, 46(1), 146–158. https://doi.org/10.1080/03639045.2019.1711387
- Mahmoud, H. (2013). Design and optimization of self-nanoemulsifying drug delivery systems of simvastatin aiming dissolution enhancement. African Journal of Pharmacy and Pharmacology, 7(22), 1482–1500. https://doi.org/10.5897/AJPP2013.2987
- Nazlı, H., Mesut, B., & Özsoy, Y. (2021). In Vitro Evaluation of a Solid Supersaturated Self Nanoemulsifying Drug Delivery System (Super-SNEDDS) of Aprepitant for Enhanced Solubility. Pharmaceuticals, 14(11), 1089. https://doi.org/10.3390/ph14111089
- Jafari, S. M., He, Y., & Bhandari, B. (2006). Nano-Emulsion Production by Sonication and Microfluidization—A Comparison. International Journal of Food Properties, 9(3), 475–485. https://doi.org/10.1080/10942910600596464
- Zhang, M., Fan, L., Liu, Y., & Li, J. (2023). Effects of interface generation, droplet size and antioxidant partitioning on the oxidation rate and oxidative stability of water–in–oil emulsions: A comparison of coarse emulsions and nanoemulsions. Food Hydrocolloids, 136, 108227. https://doi.org/10.1016/j.foodhyd.2022.108227
- Mountain, G. A., Jelier, B. J., Bagia, C., Friesen, C. M., & Janjic, J. M. (2014). Design and formulation of nanoemulsions using 2-(poly(hexafluoropropylene oxide)) perfluoropropyl benzene in combination with linear perfluoro(polyethylene glycol dimethyl ether). Journal of Fluorine Chemistry, 162, 38–44. https://doi.org/10.1016/j.jfluchem.2014.03.007
- Das, S., & Chaudhury, A. (2011). Recent Advances in Lipid Nanoparticle Formulations with Solid Matrix for Oral Drug Delivery. American Association of Pharmaceutical Scientists PharmSciTech, 12(1), 62–76. https://doi.org/10.1208/s12249-010-9563-0
- Zaichik, S., Steinbring, C., Jelkmann, M., & Bernkop-Schnürch, A. (2020). Zeta potential changing nanoemulsions: Impact of PEG-corona on phosphate cleavage. International Journal of Pharmaceutics, 581, 119299. https://doi.org/10.1016/j.ijpharm.2020.119299
- Alhamdany, A. T., Saeed, A. M. H., & Alaayedi, M. (2021). Nanoemulsion and Solid Nanoemulsion for Improving Oral Delivery of a Breast Cancer Drug: Formulation, Evaluation, and a Comparison Study. Saudi Pharmaceutical Journal, 29(11), 1278–1288. https://doi.org/10.1016/j.jsps.2021.09.016
- Soobrattee, M. A., Neergheen, V. S., Luximon-Ramma, A., Aruoma, O. I., & Bahorun, T. (2005). Phenolics as potential antioxidant therapeutic agents: Mechanism and actions. Mutation Research/Fundamental and Molecular Mechanisms of Mutagenesis, 579(1–2), 200–213. https://doi.org/10.1016/j.mrfmmm.2005.03.023
- Chavan, R. B., Modi, S. R., & Bansal, A. K. (2015). Role of solid carriers in pharmaceutical performance of solid supersaturable SEDDS of celecoxib. International Journal of Pharmaceutics, 495(1), 374–384. https://doi.org/10.1016/j.ijpharm.2015.09.011
- Pandita, D., Khar, R. K., … Ahuja, A. (2009). Characterization and in vitro assessment of paclitaxel loaded lipid nanoparticles formulated using modified solvent injection technique, (5), 301–310. https://doi.org/10.1691/ph.2009.8338.
- Wahyuni, D. S. C., Febrinasari, R. P., Sakinah, Mardiyah, A., & Choiri, S. (2024). Phyto-Nanoemulsion Containing Tea Leaves Extract Incorporated into A Hydrogel-Based Peel-Off Mask Formulation: Development, Antioxidant Assay, and Ex-Vivo Transport Study. Pharmaceutical Sciences, 30(1), 98–108. https://doi.org/10.34172/PS.2023.21
- Bali, V., Ali, M., & Ali, J. (2010). Study of surfactant combinations and development of a novel nanoemulsion for minimising variations in bioavailability of ezetimibe. Colloids and Surfaces B: Biointerfaces, 76(2), 410–420. https://doi.org/10.1016/j.colsurfb.2009.11.021
- Solans, C., & Solé, I. (2012). Nano-emulsions: Formation by low-energy methods. Current Opinion in Colloid & Interface Science, 17(5), 246–254. https://doi.org/10.1016/j.cocis.2012.07.003
- Nepal, P. R., Han, H. K., & Choi, H. K. (2010). Preparation and in vitro–in vivo evaluation of Witepsol® H35 based self-nanoemulsifying drug delivery systems (SNEDDS) of coenzyme Q10. European Journal of Pharmaceutical Sciences, 39(4), 224–232. https://doi.org/10.1016/j.ejps.2009.12.004
- Wang, B., Cai, T., Liu, Q., Whitney, J., Du, M., Ma, Q., … Cai, Y. (2018). Preparation and evaluation of spirulina polysaccharide nanoemulsions. International Journal of Molecular Medicine. https://doi.org/10.3892/ijmm.2018.3717.
No competing interests reported.
- GA.png
Graphical Abstract