Mice treated with FDI or FCM become iron overloaded
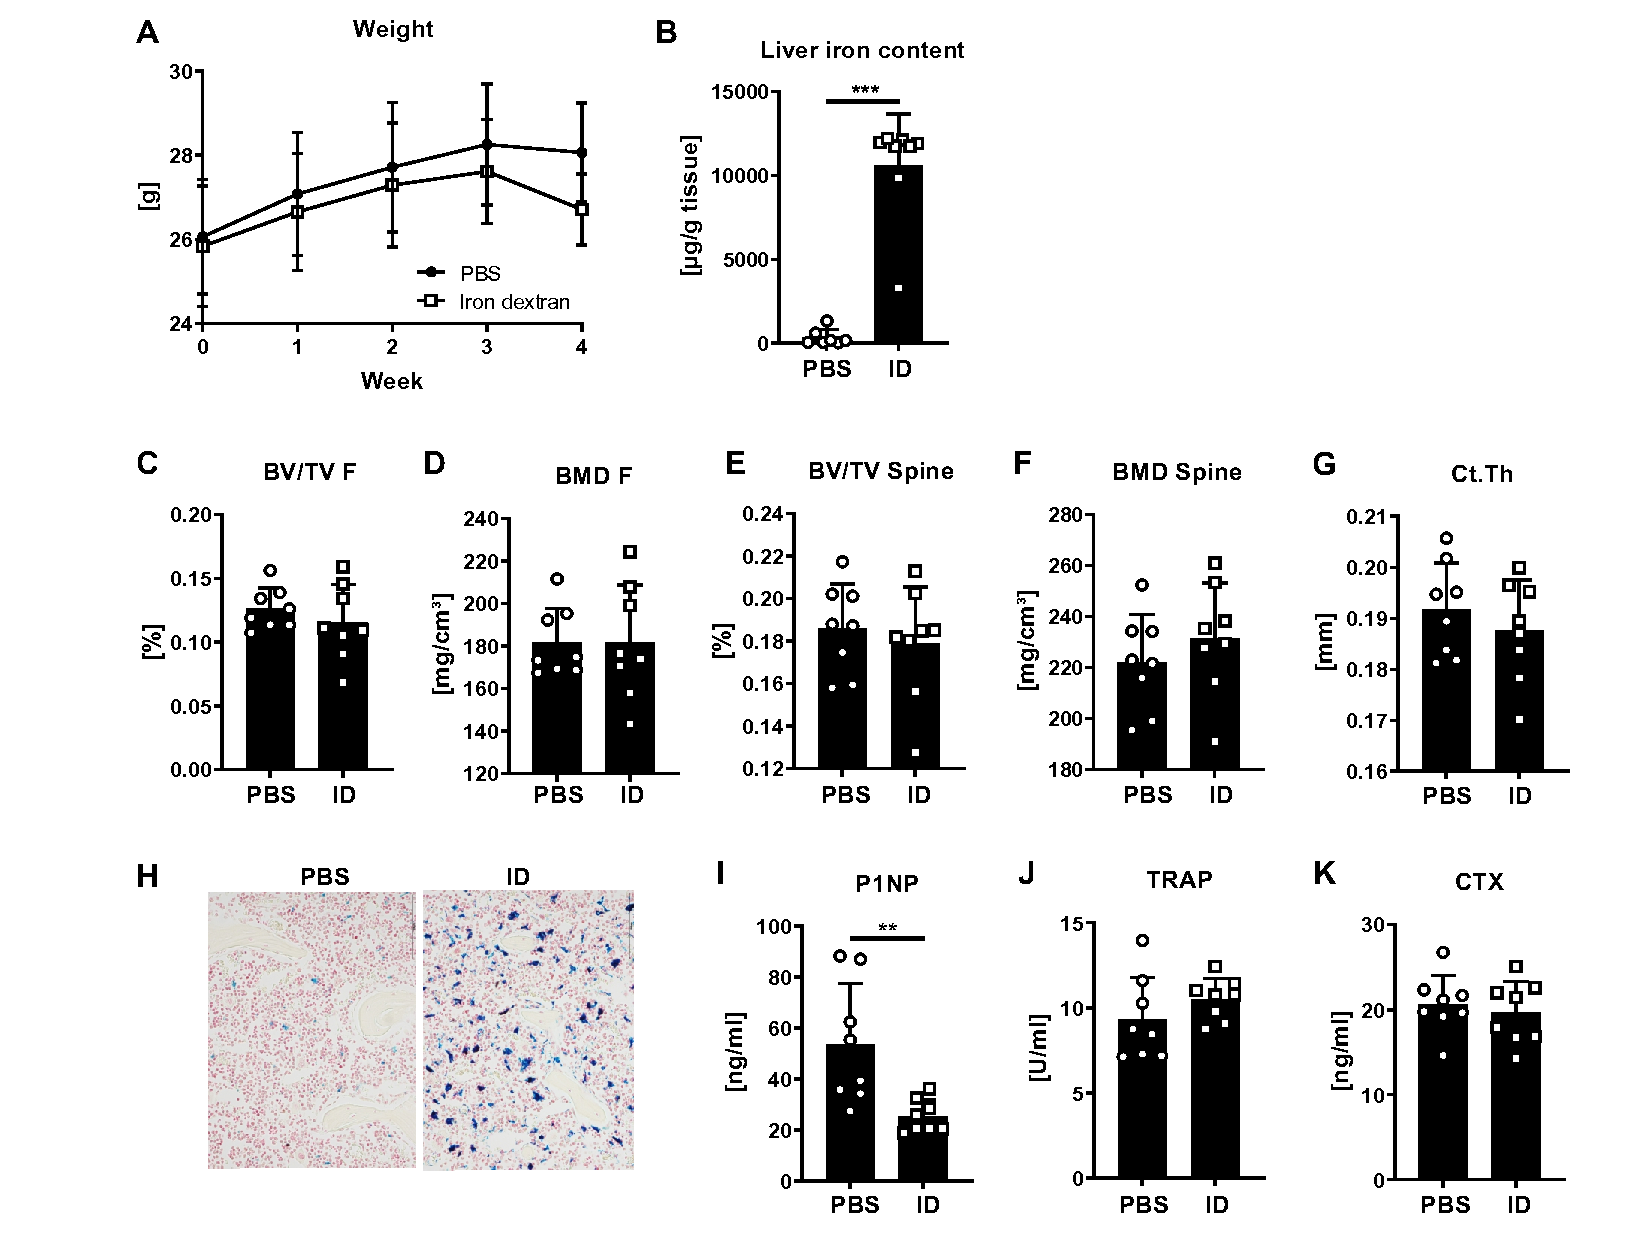
To investigate how our treatment scheme with FDI or FCM affects the general health of mice, we monitored their body weight weekly and analyzed their blood counts as well as their liver iron content at the end of the experiment. Both, FDI and FCM led to a reduction of body weight towards the end of the experiment (Fig. 1A, FDI: -9%, p < 0.01; FCM: -12%, p < 0.001). Moreover, assessing the liver iron content revealed a heavy iron deposition in the liver with both iron formulations (Fig. 1B). This was accompanied by high serum iron levels and iron-saturated transferrin levels, reaching nearly 100% (Fig. 1C-D). Applying another iron formulation, iron dextran (ID), at the same dose to mice resulted in similar effects, with the mice showing a 5% decrease in body weight (p < 0.05) and a high amount of iron in the liver (Suppl. Figure 1A, B).
Concerning the blood counts, FCM and ID overall showed a similar profile, while FDI showed milder effects (Table 1). FCM and ID significantly reduced the red blood cell count as well as the hematocrit and hemoglobin (Table 1). Mean corpuscular volume was reduced by all three iron treatments (Table 1). All iron sources led to an increase in white blood cells, with FCM and ID showing the largest increase (Table 1). In particular the number of monocytes and neutrophils were increased, while lymphocytes were decreased in number (Table 1). Finally, all treatments led to a reduction in reticulocytes (Table 1). Thus, all iron treatments led to a similar iron overload and inflammatory profile after 4 weeks of treatment.
Table 1
Blood counts in mice treated with multiple doses of iron.
| | Control N = 8 | FDI N = 8 | FCM N = 8 | Control N = 8 | Iron dextran N = 8 |
|---|
Red blood cells [106/ µl] | 9.95 ± 0.75 | 9.38 ± 0.44 | 8.78 ± 0.49** | 9.59 ± 0.34 | 8.33 ± 1.11* |
Hematocrit [%] | 48.7 ± 3.84 | 44.6 ± 2.72* | 41.6 ± 2.58*** | 48.0 ± 2.00 | 40.0 ± 5.71** |
Hemoglobin [g/dl] | 9.08 ± 0.63 | 8.63 ± 0.56 | 8.14 ± 0.46** | 8.85 ± 0.42 | 7.69 ± 1.01* |
MCV [fl] | 48.95 ± 0.61 | 47.43 ± 0.64*** | 47.38 ± 1.23** | 49.98 ± 0.90 | 48.28 ± 0.67** |
MCH [pg] | 0.91 ± 0.025 | 0.92 ± 0.021 | 0.93 ± 0.024 | 0.92 ± 0.02 | 0.92 ± 0.01 |
MCHC [g/dl] | 18.64 ± 0.43 | 19.33 ± 0.41** | 19.59 ± 0.57** | 18.48 ± 0.48 | 19.13 ± 0.24** |
Platelets [103/ µl] | 317.8 ± 29.4 | 278.0 ± 31.0* | 225.6 ± 25.6*** | 327.0 ± 191.2 | 648.4 ± 109.4 |
White blood cells [103/µl] | 10.86 ± 2.39 | 14.68 ± 3.70* | 17.95 ± 3.80*** | 9.42 ± 4.05 | 18.23 ± 5.32** |
Neutrophils [%] | 8.99 ± 1.44 | 12.38 ± 4.13 | 14.8 ± 3.80** | 5.80 ± 1.77 | 7.99 ± 2.86 |
Lymphocytes [%] | 87.63 ± 2.18 | 72.09 ± 14.16* | 66.34 ± 6.55*** | 91.79 ± 2.69 | 85.21 ± 7.59* |
Monocytes [%] | 2.86 ± 1.26 | 15.08 ± 11.97* | 18.21 ± 6.67*** | 2.16 ± 1.73 | 4.14 ± 1.57* |
Reticulocytes [109/L] | 232.4 ± 23.97 | 130.2 ± 37.4*** | 113.3 ± 75.34*** | 236.8 ± 48.85 | 91.76 ± 18.15*** |
| MCV = mean corpuscular volume. MCH = mean corpuscular hemoglobin. MCHC = mean corpuscular hemoglobin concentration. Data represent the mean ± SD. Statistical analysis was conducted using the Student´s t-test for comparisons between Control and Iron dextran, and one-way analysis of variance (ANOVA) followed by Tukey’s post-hoc test for comparisons among Control, FDI and FCM. *p < 0.05; **p < 0.01; ***p < 0.001. |
FDI and FCM show distinct bone and bone marrow characteristics
Next, we investigated the bone microarchitecture of the mice using µCT and tested their bone strength using biomechanical tests (Fig. 2). Except for bone mineral density (BMD) at the distal femur, FDI led to the expected reductions of trabecular bone volume, BMD and tissue mineral density (TMD) at the femur and fourth vertebral body (Fig. 2A-G). Moreover, FDI did not alter the BMD at the femoral cortical bone, but led to a reduction in cortical thickness (Fig. 2H-I). This phenotype resulted in a reduction of bone strength (Fig. 2J). Interestingly, FCM led to different outcomes, showing only a reduction of bone volume at the spine, but no alterations in volume at the femur and even increased (femur) or a trend to an increased (spine) trabecular BMD, which is also reflected by the representative image of the bone microarchitecture (Fig. 2A-B, D, E-F). Importantly, TMD was decreased by FCM treatment at both sites (Fig. 2C, G). Cortical bone was negatively affected by FCM treatment, showing reduced BMD and thickness of the cortex (Fig. 2H-I). ID treatment did not lead to major alterations in trabecular or cortical bone volume, BMD or TMD (data not shown) of the spine or femur (Suppl. Figure 1C-G).
As TMD was decreased in the FCM-treated group, which only takes the mineralized tissue into account, but not BMD, which considers both, the mineralized and soft tissues, we wondered if some of the “density” signal could stem from iron deposition in the bone marrow. To that end, we evaluated the bone marrow compartment of the femoral midshaft using the same BMD threshold as for the trabecular bone analysis of the distal femur. Indeed, mice treated with FCM showed a higher BMD in the bone marrow compartment as compared to PBS or FDI-treated mice (Fig. 3A). Bone volume and TMD, which in general were very low in the bone marrow compartment, was decreased in the FDI group, but not in the FCM group (Fig. 3B-C). Histological analyses of the bones confirmed the µCT data, showing a significant accumulation of iron in the bone marrow of FDI- and FCM-treated mice, however, with distinct forms of deposition (Fig. 3D). While FDI resulted in iron-loaded macrophages scattered throughout the bone marrow, FCM led to a significant accumulation of iron in “iron clusters”, which may result in the increased BMD signal in the µCT (Fig. 3E-F). Both iron treatments increased the amount of iron-covered surface, but FCM showing the largest increase (Fig. 3G). ID resulted in a similar pattern of iron deposition in the bone marrow as FDI (Suppl. Figure 1H).
Taken together, both, FDI and FCM reduced bone TMD, but only FDI also led to reductions in trabecular bone volume and BMD. This may stem from the major accumulation of iron clusters in the bone marrow of FCM-treated mice, which may provide a “false-positive” signal for BMD measurements using µCT.
Bone mineralization is not affected by FDI or FCM
We further analyzed the bone mineral density distribution (BMDD) in the mature trabecular bone region of vertebral bodies of mice treated with PBS, FDI and FCM (Fig. 4A-B), which only showed minor differences between the groups. Mean and peak calcium concentrations were similar between all groups (Fig. 4C-D). CaWidth, (assessed as FWHM), a measure for the heterogeneity of the calcium concentration, showed a trend towards narrower curves in mice treated with FDI (p = 0.08) and a significantly lower value in FCM-treated mice (p < 0.001) (Fig. 4E). CaLow and CaHigh, measures indicating percentage areas with low and high calcium concentrations, respectively, did not show clear differences between the groups. However, in FCM-treated mice, slight trends towards lower bone areas with high and low mineralization indicate a more homogeneous calcium concentration within vertebral bone (Fig. 4F-G).
FDI and FCM significantly reduce bone formation
To address how FDI and FCM affect bone turnover, we performed dynamic bone histomorphometry and analyzed serum bone turnover markers. At histological level, both FDI and FCM led to a reduced bone volume (Fig. 5A), supporting our hypothesis that the µCT picked up false-positive signals from the bone marrow in the FCM group resulting in unaltered bone volume. Both iron formulations led to a drastic reduction in mineralized surface, mineral apposition rate, and the bone formation rate with almost no calcein labels seen in the iron-treated groups (Fig. 5B-C). Accordingly, serum levels of the bone formation marker P1NP were reduced by 25% in both groups (Fig. 5D). The number of osteoclasts was decreased to a similar extent in FDI- and FCM-treated mice, while TRAP serum levels were increased and serum CTX levels showed no difference (Fig. 5E-H). Despite no changes in bone volume, ID treatment also led to an inhibition of bone formation as displayed by the reduced levels of P1NP with no alterations of serum TRAP or CTX levels (Suppl. Figure 1I-K). Taken together, all iron formulations drastically decrease the bone formation rate with smaller effects on osteoclasts.
FDI and FCM result in increased osteoid production and high FGF-23 levels
As the administration of FCM has been associated with an increase in FGF-23 levels and potentially osteomalacia, we analyzed osteoid and FGF-23 levels as well. FDI and FCM led to a marked increase in osteoid width, osteoid volume, and osteoid surface compared to PBS-treated mice (Fig. 6A-C). Large osteoid seams were observed in the iron treated mice, especially in mice treated with FDI (Fig. 6D). Both, FDI and FCM treatment resulted in increased intact and C-terminal serum levels of FGF-23, with FCM leading to higher increases than FDI (Fig. 6E-F). As the intact FGF-23 was stronger up-regulated (6-fold with FDI and 13.5-fold with FCM) than the C-terminal FGF-23 (5.7-fold with FDI and 12.9-fold with FCM), the i:cFGF-23 ratio increased in both FCM- and FDI-treated mice. However, both i:cFGF-23 ratio were elevated to a similar extent (Fig. 6G), potentially explaining the mechanism underlying the increased osteoid formation.
Single injection of FDI and FCM results in milder effects on bone than repeated injections
Even though mouse studies frequently use repeated doses of iron to assess its effects on bone, we wanted to better mimic the clinical application of iron and thus, administered FDI and FCM only once and analyzed the bone outcomes after four weeks. Despite significant iron overload in several tissues (liver, spleen, bone marrow, bone), FDI and FCM treatment did not affect the body weight at the end of the experiment (Suppl. Table 1). Moreover, within the blood, FDI only increased white blood cell counts and reduced the number of reticulocytes (Suppl. Table 1). FCM in contrast already exerted stronger effects on the red blood cell compartment (reduced hematocrit, hemoglobin, MCV, reticulocytes) and elicited a stronger inflammatory response (higher numbers of white blood cells, in particular neutrophils) (Suppl. Table 1).
In the bone, FDI led to non-significant decreases of bone volume, but already increased osteoid surface per bone surface 6-fold as well as intact and C-terminal levels of FGF-23, which however did not lead to an increase in the i:cFGF-23 ratio (Fig. 7A-E). Serum levels of P1NP were not changed, while serum TRAP levels were non-significantly increased by 25% (Fig. 7F-G). In contrast, even after one injection of FCM, bone volume was decreased and osteoid surface increased (3-fold) along with increases in intact and C-terminal FGF-23 (however not resulting in an increased ratio) (Fig. 7H-L). Serum levels of P1NP were significantly reduced, while TRAP levels were increased by 58% four weeks after a single FCM injection (Fig. 7M-N).