Materials and chemical substances
Raw sugarcane bagasse (SCB) was gathered from juice merchants in the Indian state of Haryana's Rohtak area. Sodium hypochlorite from Loba Chemie was used as a bleaching agent. CDH provided sodium hydroxide and hydrogen peroxide. All chemical compounds used in this experimental study were of analytical grade.
Raw Material Preparation
To guarantee total cleanliness, the substrate was cleaned adequately with running tap water to remove dirt and then sun-dried. Following this, the substrates were ground and sieved with a sieve of size 0.2 mm (Yadav et al. 2024). The sieved SCB powder was stored in a ziplock container at room temperature.
Determination of the Chemical composition of Sugarcane bagasse
The composition of SCB affects the bioconversion processes. A significant proportion of sugarcane bagasse consists of cellulose, cemicellulose and lignin. Apart from these compositional ingredients, it includes other elements like extractives, moisture, nitrogen, organic carbon, ash, and trace elements (Alokika et al. 2021). The SCB in this study was analysed for extractive, lignin, holocellulose, cellulose, and hemicellulose content. The process diagram for the compositional analysis of Sugarcane bagasse is shown in Fig. 2.
Extractives
In the Soxhlet extractor setup, 150 ml of acetone and 2.5 g of SCB were taken. During a 4-hour run period, the residence periods for the boiling and rising stages were meticulously set to 70 and 25 minutes, respectively, on the heating mantle. The extracted sample was allowed to air dry for a few minutes at room temperature. The removed material's weight remained constant in a convection oven set at 105°C. The extractive content can be calculated using Eq. (1) (TAPPI T 204 cm-17).
$$\:\text{E}\text{x}\text{t}\text{r}\text{a}\text{c}\text{t}\text{i}\text{v}\text{e}\text{s}\left(\text{%}\right)=\frac{W1}{W}x100$$
1
Where W = Initial weight of SCB and W1 = Final weight obtained after treatment.
Lignin
The Tappi T222 om-88 (Tappi test methods) determines the amount of lignin in biomass samples. 1 g of extractive-free biomass and a 72% H2SO4 solution were heated for two hours at room temperature. After diluting the sample with water to bring the sulphuric acid concentration down to 3 per cent, it is boiled for an additional four hours. The lignin is then filtered after being given time to settle. The residue is rinsed with hot water until a neutral pH is achieved. The extracted lignin content can be determined using Eq. (2) (Rizwan et al. 2021).
$$\:Lignin\left(\%\right)=\frac{W3}{W2}x100$$
2
Where, W2 = Initial sample mass and W3 = Obtained sample mass.
Holocellulose
With a few modifications, the conventional procedure outlined by Wise et al. (1946) was used to determine the holocellulose content. 10 g of SCB was bleached using hydrogen peroxide buffered with sodium hydroxide solution. The mixture was heated at 70°C for 4 hours. Once the mixture had cooled, the residue was filtered out, cleaned with water, dried, and weighed. Hollocellulose, a blend of cellulose and hemicellulose found in residues, can be quantified using Eq. (3) (Rizwan et al.2021).
$$\:\text{H}\text{o}\text{l}\text{o}\text{c}\text{e}\text{l}\text{l}\text{u}\text{l}\text{o}\text{s}\text{e}\left(\text{%}\right)=\frac{\text{W}5}{\text{W}4}\text{x}100$$
3
Where W4 = Weight of the original sample, and W5 = Weight of the obtained holocellulose.
Cellulose
For cellulose content determination, a 1 g sample of holocellulose and 25 ml of 17.5% NaOH were combined in a flask and heated at 95°C for one hour. 25 millilitres of distilled water (DW) was added, and the residue was filtered. After that, 25 millilitres of a 10% acetic acid solution was added, filtered once more, and repeatedly cleaned with distilled water. The amount of cellulose residue was determined after the sample was dried for 24 hours at 40°C. Silva et al. (2011). Cellulose content percentage is determined using Eq. (4) (Song et al. 2019).
$$\:\text{C}\text{e}\text{l}\text{l}\text{u}\text{l}\text{o}\text{s}\text{e}\left(\text{%}\right)=\frac{\text{W}7}{\text{W}6}\text{x}100$$
4
Where = Initial amount of holocellulose and W7 = Final amount of extracted cellulose.
Hemicellulose
The difference between the holocellulose and cellulose concentrations was calculated to determine the hemicellulose fraction (Eq. 5) (Balasubramani et al. 2024). The percentage that remains after deducting cellulose from holocellulose is hemicellulose. This formula is frequently used to analyse the composition of plant fibres in wood science, biomass research, and the paper industry.
Hemicellulose = Holocellulose − Cellulose (5)
Isolation of Cellulose
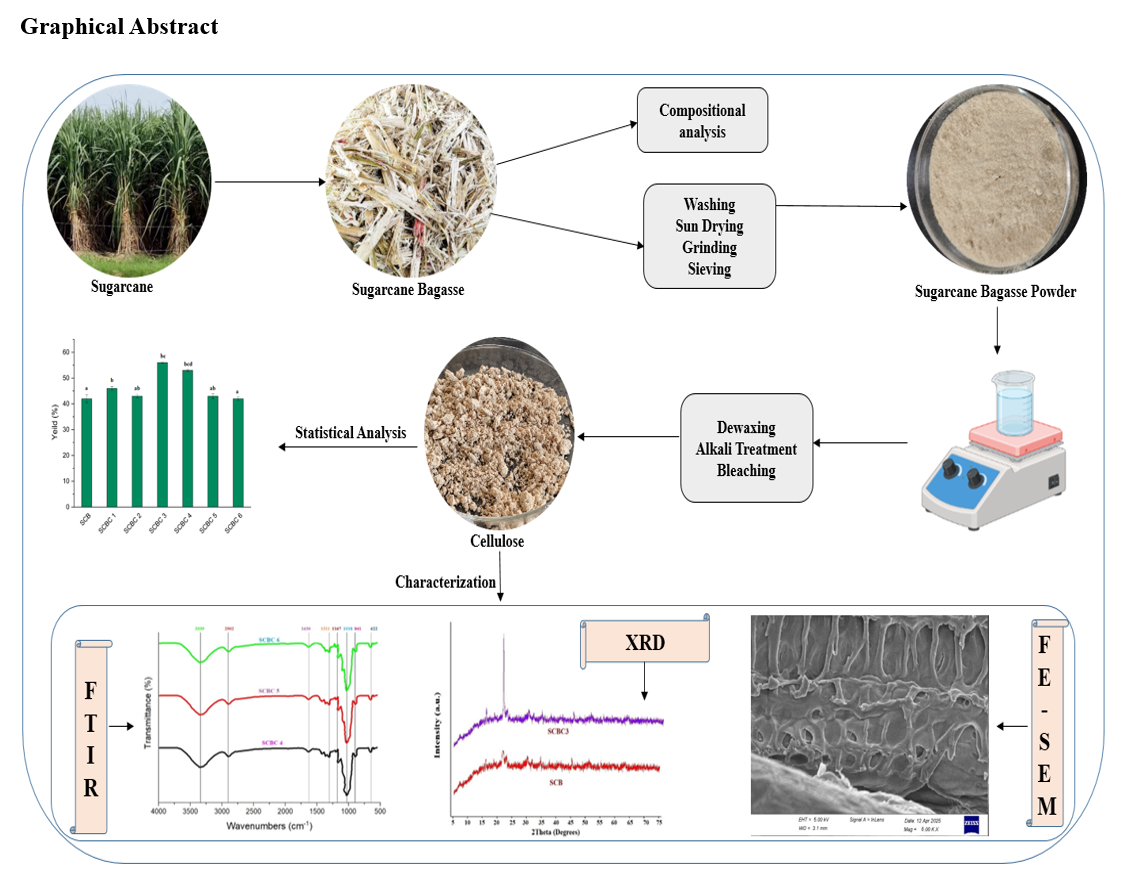
In this study, cellulose extraction was conducted with the help of combined and modified methods of Ungprasoot et al. (2021), Melesse et al. (2022) and Khiewsawai et al. (2023). The process of cellulose extraction from sugarcane bagasse is shown in Fig. 3, and it mainly involves three steps: dewaxing using ethanol, alkaline treatment using NaOH and bleaching treatment using NaOCl. The cellulose yield(%) is greatly affected by the amount of NaOH and NaOCl used. Thus, the two are used in varying concentrations, and six samples were prepared and labeled accordingly as given in Table 1.
Table 1
Chemical Processing Conditions for Cellulose Extraction from Sugarcane bagasse.
Sample | NaOH (%) | NaOCl (%) |
|---|
SCBC1 | 2 | 1.5 |
SCBC2 | 2 | 3 |
SCBC3 | 5 | 1.5 |
SCBC4 | 5 | 3 |
SCBC5 | 8 | 1.5 |
SCBC6 | 8 | 3 |
Dewaxing
Dewaxing was done using a solution of ethanol and deionised water in 1:1 v/v for around four hours, then boiling the mixture for 1.5 hours. This procedure was repeated twice to remove dust, dirt, sugar extracts, and water-soluble contaminants. To remove any remaining sugar and surfactants, the mixture was rinsed with hot water first, followed by cold water. After that, it was oven-dried for a whole day.
Alkaline Treatment
Three varying concentrations 2%, 5%, and 8% of sodium hydroxide (NaOH) solution(200 ml ) were applied to a 10 g sample to perform the alkaline treatment. The samples were heated for two hours, stirring occasionally, to a temperature of 75°C. This process made the desired changes possible, guaranteeing that the sample and the alkaline solution interacted well. They were then extensively cleaned with distilled water to neutralise the solid residue that had been produced.
Bleaching
Two hundred millilitres of NaOCl at two differing concentrations 1.5% and 3% was used to bleach the residue left over after the alkaline treatment. For 30 minutes, residue obtained after alkali treatment was heated to 80°C while being constantly stirred and then to attain a neutral pH it was cleaned with distilled water.
Then for 16 hours, the isolated cellulose samples were oven-dried at 50°C. After oven drying, it was ground into a fine powder and kept in ziplock containers to retain moisture.
Yield
Cellulose yield indicates the proportion of cellulose successfully extracted, reflecting cellulose recovery efficiency. The yield was calculated as a percentage relative to the dry weight of the SCB after treatments. Accurate measurements of the initial and final weights of SCB and SCBC were used to determine the yield using Eq. (6) (Mubarak et al., 2024).
$$\:\text{Y}\text{i}\text{e}\text{l}\text{d}\left(\text{%}\right)=\frac{\text{W}9}{\text{W}8}\text{x}100$$
6
W8 = Initial weight of SCB, and W9 = Final weight of extracted cellulose.
Characterization
FTIR Analysis
Fourier transform infrared (FTIR) Spectroscopy was used to examine the functional groups. Bruker's Invenio ® FTIR spectrometer was employed. It had a 2 cm− 1 resolution and was operated in gearbox mode. FTIR spectra were obtained over a range of wavenumbers from 4000 to 400 cm− 1.
XRD
A multifunctional, adaptable X-ray diffractometer system of model Smartlab 3kW/Rigaku was used to conduct the X-ray diffraction analysis. With a phase of 0.04 and a scanning time of five minutes, the analysis was carried out in the 2β range value scanned from 10 to 50º. Segals method [(Eq. (7)] was used to calculate crystallinity index (Segal et al. 1959).
CrI (%) = [(I002 - Iam) / I002] × 100 (7)
Where, I002 = Intensity of the crystalline peak and Iam = Intensity of the amorphous background
FE-SEM
The micrographs were obtained using a Carl Zeiss field emission scanning electron microscope. The aluminium stubs were covered with a layer of gold after the dried, finely powdered SCB and SCBC3 samples were put on them. Better conductivity is guaranteed by this gold coating, which also improves the quality of the images acquired during the ensuing image processing procedure.
Statistical analysis
The experimental work was performed in triplicates. The results are given as the mean value and its corresponding standard deviation. The mean of altered treatments, Dunnett test for control, and analysis of variance (ANOVA) were assessed using Tukey’s test at the 0.5% statistical level in the IBM SPSS Statistics 25.0. Statistically significant differences among treatments are indicated by different letters in the figures, based on the Tukey multiple comparison test (p ≤ 0.05). Graphs were generated using Origin software.